

Angular debugging pluginAngularJS Batarang
Nowadays, when we are engaged in front-end development, the popular MVVM framework is definitely unavoidable. So here are three popular framework Devtools, if you need to pick them up yourself. Vue.js devtools, AngularJS BatarangReact, Developer Tools. This article mainly introduces AngularJS Batarang
How to use the AngularJS Batarang plug-in
For the offline installation method of the AngularJS Batarang plug-in, please refer to the following method: For the old version of chrome browser, first enter [chrome://extensions/] on the tab page to enter the chrome extension, and unzip the content you have on this site Download the plug-in and drag it into the extension page.

2. When the latest version of Chrome browser is directly dragged and dropped to install, "The package is invalid" will appear. CRX-HEADER-INVALID" error message, please refer to Baidu: The solution to "CRX-HEADER-INVALID" appears when installing the Chrome plug-in. You can use it after installation.

3. After the installation is complete, the icon will appear in the plug-in bar.

4. Open an Angular application in the chrome browser and open the console, as shown below, you will find that there is an additional On the AngularJS page, check "Enable" and the control can be used.

5. Click on Models, as shown below. The left side is the information of all Scopes under the application, and the right side is the corresponding Scope. model information. Click on a scope, and all model information in the scope will be displayed on the right. Click "<" before Scope to jump to the DOM tag where the scope is located in Elements.

6.Performace shows the performance of the application. The monitoring tree is displayed on the left. Click on the node of the tree to jump to on the corresponding element element. Shown on the right is the performance of monitoring expressions. This page can help us optimize performance.

7. Dependenices displays the dependencies between instructions and services. Select an instruction to see the services it depends on. . Visualize the dependencies between services through charts. The red lines represent dependencies
8. Finally is the options page. There are three options: "show applications," "show scopes," and "show bindings." When each option is checked, the corresponding content will be highlighted on the page during debugger. 
9. If you have any questions, please check help
10. Select in the Element tag When a certain tag is clicked, the content on the right side of the Element page will have an additional AngularJS Properties page. This page displays the properties of the scope of the selected html content. This function is very useful for understanding Angular Scope. If you don’t understand Angular Scope very well, you can use this function more. 
All resources on this site are contributed by netizens or reprinted by major download sites. Please check the integrity of the software yourself! All resources on this site are for learning reference only. Please do not use them for commercial purposes. Otherwise, you will be responsible for all consequences! If there is any infringement, please contact us to delete it. Contact information: admin@php.cn
Related Article
 How to fix blurry text in Chrome
29 Jul 2025
The problem of fuzzy text in Chrome browser can be solved by the following methods: 1. Set Windows system scaling to 100% or enable "force scaling of Chrome content"; 2. Enable WebGPUrendering and GPUrasterization in chrome://flags and enable hardware acceleration; 3. Clear browser cache or reset settings and troubleshoot plug-in conflicts. In most cases, the display effect can be significantly improved after adjustment.
 How to fix Chrome not opening mailto: links in Gmail
17 Jul 2025
The main reason Chrome does not open the mailto: link directly in Gmail is that the default mail client is not set correctly or Gmail is not registered as an application that handles the mailto: protocol. Solutions include: 1. Set Gmail as the default mail application in Windows settings; 2. Enable Gmail protocol processing permissions in Chrome and set as default; 3. Manually click on the mailto: link to contact the Gmail registration protocol; 4. Use Chrome plug-in such as Mailto:forGmail to force jump. In most cases, it can be solved through system and browser settings, and the plug-in can be used as a backup solution.
 How to Disable and Enable Chrome Extensions/Plug-Ins/Add-Ons?
04 Jun 2025
For some reason, you may want to disable Chrome extensions, plug-ins, or add-ons from your computer. But do you know how to disable Chrome extensions? It is very simple. php.cn Software will show you a guide in this post. On the other hand, you can a
 How to make Gmail the default email client
24 Jul 2025
To set Gmail as the default mailbox, you need to set the system and browser protocol according to the platform. 1. In Windows: go to "Settings>Applications>Default Applications", select Chrome and other browsers as the default mail client; then set "mailto" to Gmail default in chrome://settings/handlers. 2. In Mac: Install the RCDefaultApp plug-in, change "mailto" to Safari or Chrome in the preference settings "URLs"; and then set Gmail as the default handler in the browser. 3. On your phone: Enter "Settings>Apps>Default Apps" to select Gmail; i
 【ES 3rd Anniversary】Windows-chrome installation of Elasticsearch-head plug-in
22 May 2025
To download the zip file of elasticsearch-head plug-in, you can use the following link: Link: https://pan.baidu.com/s/1fksEifwtAQ-L1DEd21KHZw Extraction Code: 8888 Installation Method 1: Install through Google Chrome First, open Google Chrome, click the "More Tools" option in the upper right corner, and then select "Extensions". Unzip the downloaded es-head.zip file, find the third-party plug-in file with the suffix .crx, and change its suffix to .rar, and then unzip it again to get a folder. After entering the extension page, enable developer mode, and then click "Load the unzipped extension" and select
 How to turn off unnecessary PS plugins?
06 Apr 2025
Turning off unnecessary PS plug-ins can improve operational efficiency. There are two ways: 1. Temporarily disable the plug-in: Edit > Preferences > Plugin Uncheck the plug-in that you don’t need to use 2. Remove the plug-in thoroughly: Find the plug-in installation location (usually in the Plug-ins folder) and delete the unwanted plug-in folder (after backup)


Hot Tools
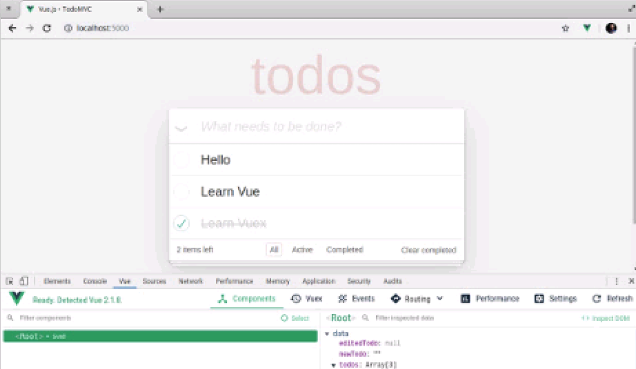
Vue.js devtools V5.1.1
Vue.js devtools is a developer browser extension for debugging vue.js applications based on the Google Chrome browser. You can debug code under the browser developer tools. IT engineers who do front-end development should be familiar with this tool. They can check the code while viewing the page in the sidebar pane. Since Vue is data-driven, there is nothing that can be parsed by viewing the DOM structure during development and debugging. But with the help of the vue-devtools plug-in, we can easily parse and debug the data structure
Talend API Tester
The Talend API Tester plug-in, formerly known as Restlet Client, is designed and developed by developers as a tool that can help programmers debug web pages. Talend API Tester makes it easy to call, discover and test HTTP and REST APIs. Enables visual interaction with REST, SOAP and HTTP APIs.
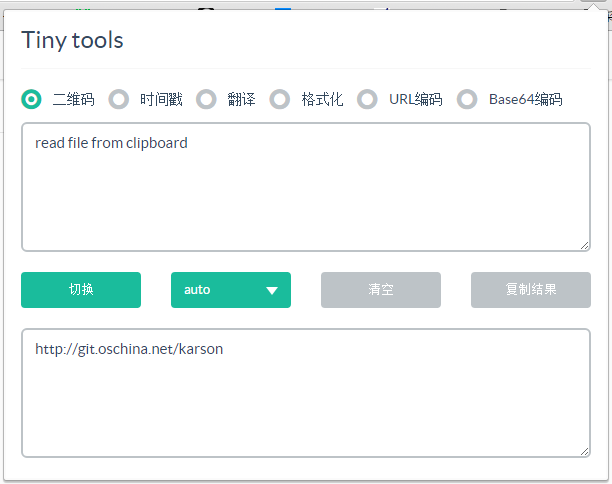
Karson / tinytools
Tiny tools is a Chrome extension that contains many useful tools, such as QR code generator, QR code decoding, translation, timestamp conversion, source format, JSON format, image base64 character encoding, etc.
Detailed SEO Extension
SEO is a search engine optimization technology. Website operators need to publish some high-quality content to meet the needs of users, so as to win the favor of search engines and bring search traffic from search engines. Measuring the search engine's love for a website is usually composed of this SEO indicator. Regarding SEO, we have introduced many plug-ins such as SEO toolbar: SEOquake, META SEO inspector, 5118 Webmaster Toolbox - Essential SEO plug-in, etc. Wait, today the editor has brought you a tool that can quickly analyze the title of a certain web page.