Identify the dump type (Complete, Kernel, or Mini) to understand the scope of data available. 2. Install WinDbg via Windows SDK, WDK, or Microsoft Store, then open the .dmp file using File → Open Crash Dump. 3. Configure symbol files with .sympath SRVC:\Symbolshttps://msdl.microsoft.com/download/symbols and run .reload to enable meaningful analysis. 4. Execute !analyze -v to get the bug check code, faulting module, and probable cause, such as IRQL_NOT_LESS_OR_EQUAL pointing to a driver like nvlddmkm.sys. 5. Use additional commands like k for stack trace, lm to list modules, !process 0 0 for running processes, !thread for thread context, and !pool
for memory pool inspection if deeper investigation is needed. 6. Interpret results by linking the faulting module or bug check code (e.g., BugCheck 0x116) to specific drivers or hardware issues, checking for common causes like faulty drivers (e.g., athw8x.sys), memory corruption, or overclocking-related WHEA_UNCORRECTABLE_ERROR. 7. For simpler analysis, use tools like BlueScreenView, WhoCrashed, or OSR Online Driver Verifier to quickly identify problematic drivers with a graphical interface. Always update drivers, verify system integrity with sfc /scannow and DISM, test RAM with Windows Memory Diagnostic or MemTest86 if crashes persist, and retain dump files for tracking recurring problems, as most issues stem from drivers or hardware failures that can be diagnosed through methodical dump analysis.
Analyzing memory dump files (.dmp) in Windows is useful for diagnosing system crashes, blue screens (BSOD), application failures, or suspicious behavior. These files contain a snapshot of system or process memory at the time of the crash. Here’s how to analyze them effectively.
1. Understand the Types of Dump Files
Before analyzing, know what kind of dump you're dealing with:
- Complete Memory Dump: Entire contents of physical memory. Very large, includes all processes and kernel data.
- Kernel Memory Dump: Only kernel-mode memory. Smaller than full dump, but still detailed.
- Mini Dump (Small Dump): Basic info like stop code, loaded drivers, and stack trace. Most common.
Location: Usually found in C:\Windows\Minidump\ (for mini dumps) or C:\Windows\Memory.dmp.
2. Set Up the Tools: Install WinDbg (Windows Debugger)
The primary tool for analyzing .dmp files is WinDbg, part of the Windows SDK or Windows Driver Kit (WDK).
Steps to install:
- Download WinDbg via:
- Windows SDK (includes WinDbg)
- Or install WinDbg Preview from Microsoft Store (modern UI, easier for beginners)
- Alternatively, use Visual Studio (has built-in debugger support)
Once installed, open WinDbg and load your dump file:
File → Open Crash Dump → Select your
.dmpfile
3. Configure Symbol Files (Crucial Step)
Symbols help map memory addresses to function and variable names (e.g., driver names). Without them, analysis is nearly useless.
In WinDbg, set the symbol path:
.sympath SRV*C:\Symbols*https://msdl.microsoft.com/download/symbols
Then reload symbols:
.reload
Tip: WinDbg will prompt to set this automatically — allow it and choose a local cache folder (e.g.,
C:\Symbols).
4. Run Basic Analysis Commands
After loading the dump, start with:
!analyze -v
This is the most important command. It:
- Shows the bug check code (e.g.,
IRQL_NOT_LESS_OR_EQUAL) - Displays arguments passed to the bug check
- Suggests the probable cause
- Lists the faulting module (e.g.,
nvlddmkm.sys— NVIDIA driver)
Example output snippet:
BUGCHECK_STR:  0x116
PROCESS_NAME:  svchost.exe
FAULTING_MODULE:  nvlddmkm
ANALYSIS_VERSION: 10.0.19041.1 amd64fre
This tells you it's likely a graphics driver issue.
5. Dig Deeper (Optional but Useful)
If !analyze -v isn’t conclusive, use these commands:
k– Show stack trace of the crashing threadlm– List loaded modules (drivers and DLLs)!process 0 0– List all processes at crash time!thread– Analyze current thread context!pool <address>– Inspect memory pool usage (for pool-related crashes)
Example: If a third-party driver is suspected:
lm m nvlddmkm
Shows details about the NVIDIA display driver module.
6. Interpret Common Crash Causes
Based on !analyze -v, common issues include:
-
Driver issue: Faulting module is a
.sysfile (e.g.,athw8x.sys— Wi-Fi driver) - Hardware problem: Repeated crashes with memory or disk-related errors
-
Memory corruption: Bug checks like
PAGE_NOT_ZERO,MEMORY_MANAGEMENT -
Overclocking: Often causes
WHEA_UNCORRECTABLE_ERROR
Tip: Search the bug check code online (e.g., “BugCheck 0x116”) for known fixes.
7. Use Alternative Tools (Beginner-Friendly)
If WinDbg feels too technical:
- BlueScreenView (NirSoft): Free GUI tool that shows minidump info, highlights faulty drivers with colors.
- WhoCrashed: Easy-to-use tool that analyzes dumps and points to problematic drivers.
- OSR Online Driver Verifier: Helps check if a driver is signed or known to cause issues.
These tools are great for quick diagnosis but less powerful than WinDbg.
Final Tips
- Always update drivers (especially graphics, storage, and network).
- Run
sfc /scannowandDISMto check system file integrity. - If crashes persist, test RAM with Windows Memory Diagnostic or MemTest86.
- Keep dump files — they’re valuable for tracking recurring issues.
Analyzing .dmp files isn’t hard once you get the basics. Start with !analyze -v in WinDbg, check the faulting module, and research the bug check code. Most crashes point to drivers or hardware — so focus there.
Basically, it's about connecting the crash data to real-world components.
The above is the detailed content of How to analyze memory dump files (dmp) in Windows. For more information, please follow other related articles on the PHP Chinese website!

Hot AI Tools

Undress AI Tool
Undress images for free

Undresser.AI Undress
AI-powered app for creating realistic nude photos

AI Clothes Remover
Online AI tool for removing clothes from photos.

Clothoff.io
AI clothes remover

Video Face Swap
Swap faces in any video effortlessly with our completely free AI face swap tool!

Hot Article

Hot Tools

Notepad++7.3.1
Easy-to-use and free code editor

SublimeText3 Chinese version
Chinese version, very easy to use

Zend Studio 13.0.1
Powerful PHP integrated development environment

Dreamweaver CS6
Visual web development tools

SublimeText3 Mac version
God-level code editing software (SublimeText3)
 How to Change Font Color on Desktop Icons (Windows 11)
Jul 07, 2025 pm 12:07 PM
If you're having trouble reading your desktop icons' text or simply want to personalize your desktop look, you may be looking for a way to change the font color on desktop icons in Windows 11. Unfortunately, Windows 11 doesn't offer an easy built-in
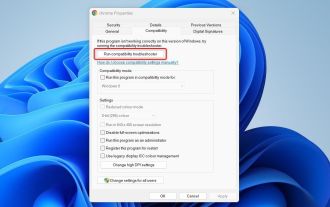 Fixed Windows 11 Google Chrome not opening
Jul 08, 2025 pm 02:36 PM
Fixed Windows 11 Google Chrome not opening Google Chrome is the most popular browser right now, but even it sometimes requires help to open on Windows. Then follow the on-screen instructions to complete the process. After completing the above steps, launch Google Chrome again to see if it works properly now. 5. Delete Chrome User Profile If you are still having problems, it may be time to delete Chrome User Profile. This will delete all your personal information, so be sure to back up all relevant data. Typically, you delete the Chrome user profile through the browser itself. But given that you can't open it, here's another way: Turn on Windo
 How to fix second monitor not detected in Windows?
Jul 12, 2025 am 02:27 AM
When Windows cannot detect a second monitor, first check whether the physical connection is normal, including power supply, cable plug-in and interface compatibility, and try to replace the cable or adapter; secondly, update or reinstall the graphics card driver through the Device Manager, and roll back the driver version if necessary; then manually click "Detection" in the display settings to identify the monitor to confirm whether it is correctly identified by the system; finally check whether the monitor input source is switched to the corresponding interface, and confirm whether the graphics card output port connected to the cable is correct. Following the above steps to check in turn, most dual-screen recognition problems can usually be solved.
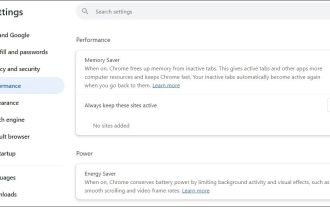 Fixed the failure to upload files in Windows Google Chrome
Jul 08, 2025 pm 02:33 PM
Have problems uploading files in Google Chrome? This may be annoying, right? Whether you are attaching documents to emails, sharing images on social media, or submitting important files for work or school, a smooth file upload process is crucial. So, it can be frustrating if your file uploads continue to fail in Chrome on Windows PC. If you're not ready to give up your favorite browser, here are some tips for fixes that can't upload files on Windows Google Chrome 1. Start with Universal Repair Before we learn about any advanced troubleshooting tips, it's best to try some of the basic solutions mentioned below. Troubleshooting Internet connection issues: Internet connection
 Want to Build an Everyday Work Desktop? Get a Mini PC Instead
Jul 08, 2025 am 06:03 AM
Mini PCs have undergone
 How to clear the print queue in Windows?
Jul 11, 2025 am 02:19 AM
When encountering the problem of printing task stuck, clearing the print queue and restarting the PrintSpooler service is an effective solution. First, open the "Device and Printer" interface to find the corresponding printer, right-click the task and select "Cancel" to clear a single task, or click "Cancel all documents" to clear the queue at one time; if the queue is inaccessible, press Win R to enter services.msc to open the service list, find "PrintSpooler" and stop it before starting the service. If necessary, you can manually delete the residual files under the C:\Windows\System32\spool\PRINTERS path to completely solve the problem.
 How to run Command Prompt as an administrator in Windows 10?
Jul 05, 2025 am 02:31 AM
To run command prompts as administrator, the most direct way is to search through the Start menu and right-click "Run as administrator"; secondly, use the Win X shortcut menu to select "Command Prompt (Administrator)" or "Windows Terminal (Administrator)"; you can also open the run window through Win R and enter cmd and press Ctrl Shift Enter to force running as administrator; in addition, you can set shortcut properties to achieve automatic running as administrator. All the above methods require administrator permission and confirmation through UAC. Pay attention to security risks during operation.


