
 web3.0
Looking back on the performance of mainstream assets in 10 years: From Bitcoin to US Treasury, who is the king of income?
web3.0
Looking back on the performance of mainstream assets in 10 years: From Bitcoin to US Treasury, who is the king of income?
Looking back on the performance of mainstream assets in 10 years: From Bitcoin to US Treasury, who is the king of income?
Sep 24, 2025 pm 12:12 PM
Table of contents
- In the competition of returns, who is the king of assets?
- The maximum drawdown, how high is the risk behind the returns?
- Correlation between assets, how to optimize asset portfolio?
- How has the performance of the five major assets been affected by major events?
- Without perfect assets, build a portfolio of assets that travel through cycles
During the period 2015-2025, the global financial market has gone through a magnificent cycle. From quantitative easing in the post-financial crisis era to the historic zero-interest rate environment, to the sharp tightening cycle triggered by coping with high inflation, the huge waves of the macro economy are constantly impacting all kinds of assets. Against this background, crypto assets represented by BTC and ETH far exceeded the standard, gold and US Treasury bonds, completing an amazing leap from a geek circle pilot to entering the balance sheet of Wall Street institutions. But the excess returns are also accompanied by extreme risks - crypto assets once experienced a deep retracement of more than 75%, and the recovery period is often measured in years, while traditional assets show stronger resilience.
In this regard, OKX Research Institute takes the "performance of the five major mainstream assets in 10 years" as the core and tries to answer a key question: on a 10-year time scale, it co-locates BTC and ETH with mainstream assets such as gold, S&P 500, and US Treasury bonds. What is the true portrait of their respective returns and risks? Do we pay equal, or even excess risk costs for the amazing returns of crypto assets? To this end, we will go beyond the comparison of single yields and strive to draw a complete, objective, and time-travel asset performance map. (Statistical data ends August 31, 2025)
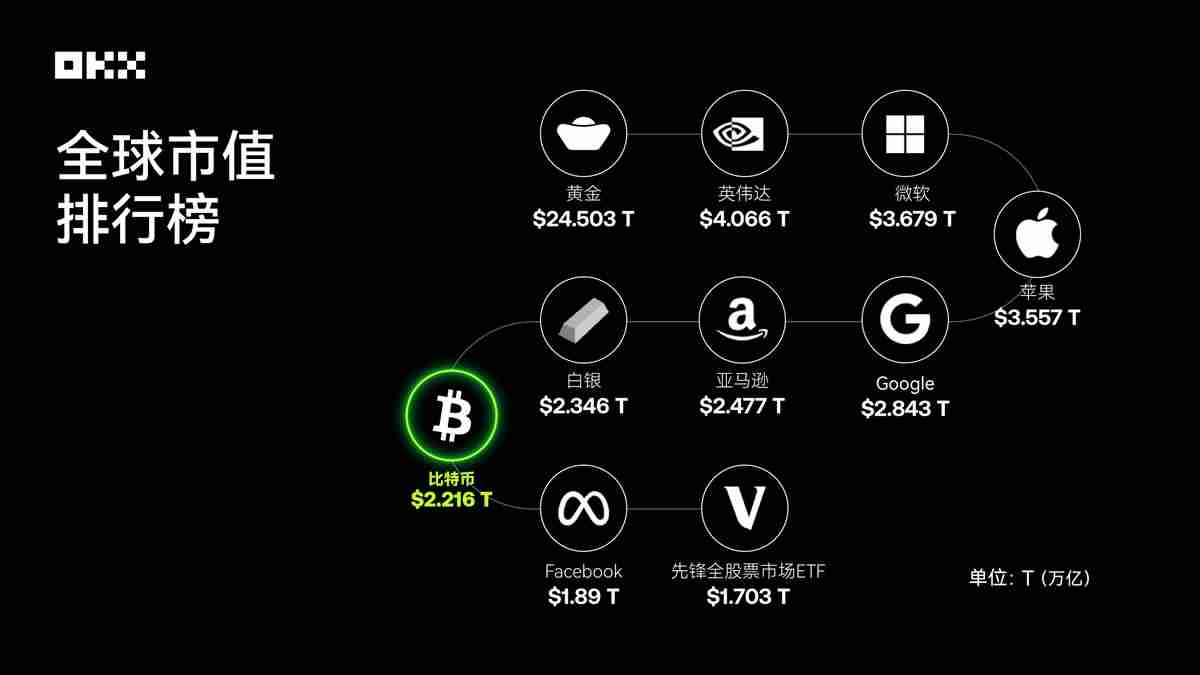
Data source: 8MarketCap; as of the end of August 2025, Bitcoin has ranked among the top
In the competition of returns, who is the king of assets?
The most intuitive way to evaluate an asset is to observe its long-term value growth trajectory. We assume that USD 10,000 was invested in these five assets on August 1, 2015 and track their cumulative value changes to August 1, 2025. This comparison clearly reveals the huge differences in the ability of different asset classes to create wealth.
(I) Annual price snapshot: Value yardstick for key nodes (2015-2025, August 1st each year)
The following table records the closing prices of five core assets from 2015 to 2025 on August 1 (or the first trading day thereafter).
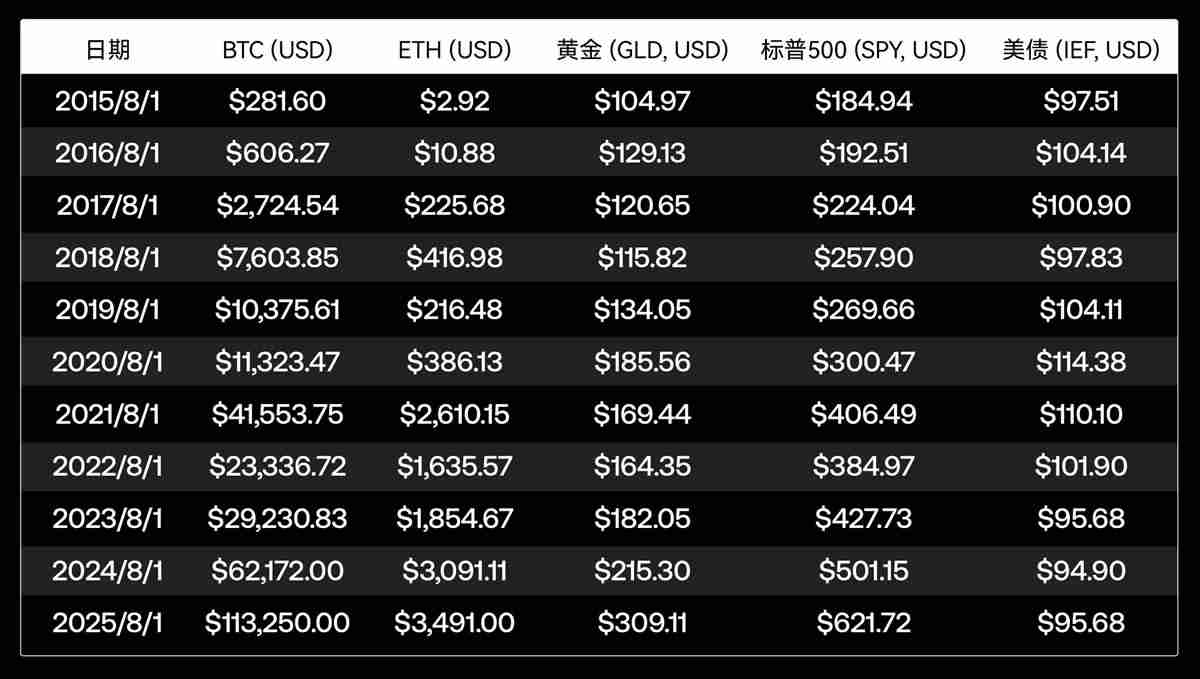
Source: Based on Yahoo Finance and CoinGecko, the closing price of the first trading day of the day or after, and the price of the ETF is the adjusted closing price
As can be clearly seen from the price snapshot, Bitcoin and Ethereum have experienced exponential growth, with the order of magnitude of its price fundamentally changing in a decade. In contrast, the S&P 500 shows a steady upward trajectory of the bull market, gold shows fluctuations related to the macroeconomic cycle, while the prices of US Treasury bonds clearly reflect changes in the interest rate environment, which is clearly under pressure during the interest rate hike cycle from 2022 to 2023.
(II) Annual peak moment: Capture the highest point of each cycle
Just observing price snapshots on a specific date is far from enough to depict the full picture of an asset. Price fluctuations during the year, especially the emergence of the highest point, reveal the potential explosiveness of assets and the "fear of missed" (FOMO) that traders may face. The following table counts the highest prices hit by each asset in each annual cycle (from August 1 of that year to July 31 of the following year).
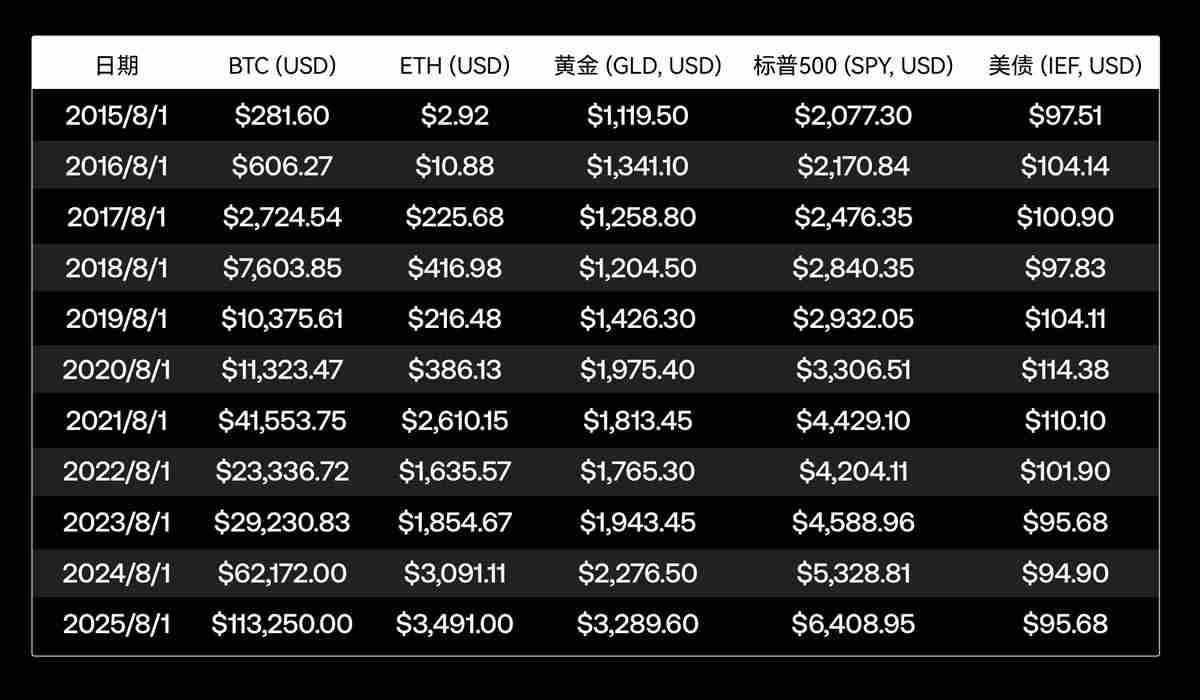
Data source: Ethereum was launched on July 30, 2015. Early data liquidity is low, or there may be some errors. The remaining data is calculated based on Yahoo Finance daily historical data
By observing the annual price vertex, we can clearly see the magnitude difference in asset growth. Bitcoin and Ethereum’s price highs in bull markets showed a staggering jump, compared to the much smaller gap between the annual highest price of the S&P 500 and gold and the snapshot price, reflecting its more mature and stable market characteristics.
(III) Wealth Growth Simulation: 10 Years of Fantasy Drifting in 10,000 USD
To more intuitively experience the wealth creation ability of different assets, we simulated a simple experiment: on August 1, 2015, USD 10,000 was bought in five assets and held until August 1, 2025. The figure below shows the cumulative value changes of this expenditure in logarithmic coordinates. This coordinate system can better handle data with huge orders of magnitude differences, avoiding the curve of high-growth assets being too steep and concealing the details of other assets.
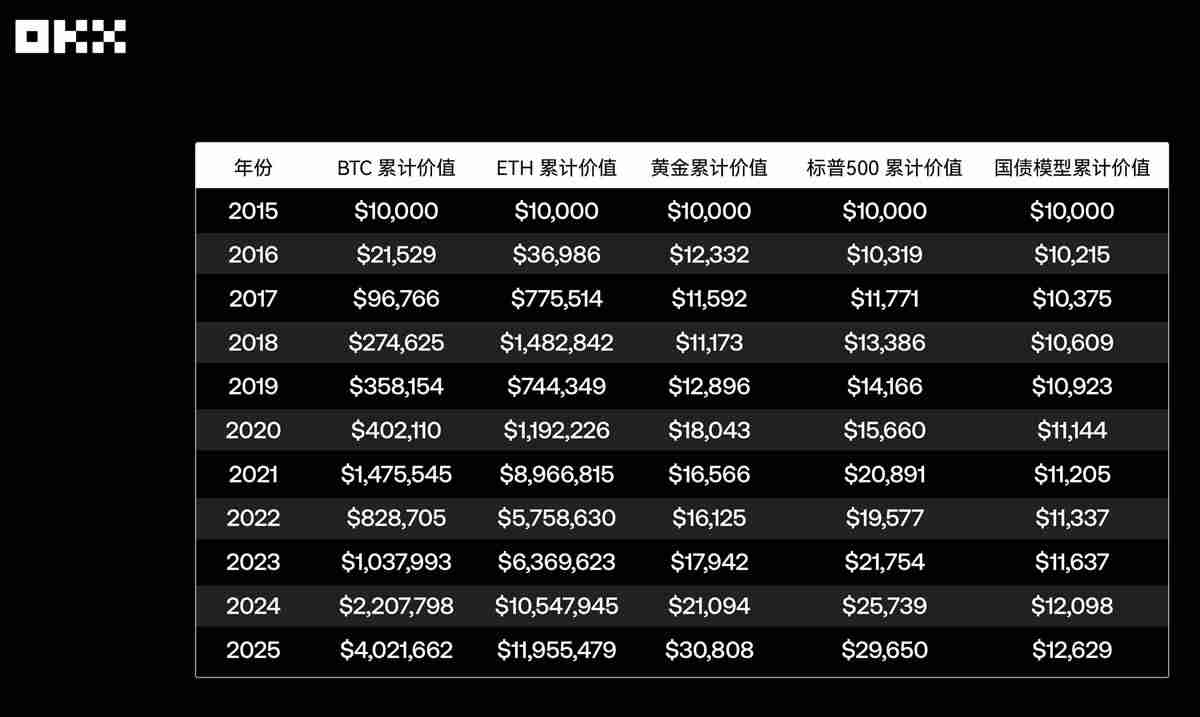
Source: Yahoo Finance, FRED, Macrotrends, etc.
The table shows that in the decade 2015-2025, the growth multiples of different assets were: BTC 402.17 times, the cumulative income in 10 years was about US$4.02 million, ETH 1195.55 times, the cumulative income in 10 years was about US$11.95 million, gold 3.08 times, the cumulative income in 10 years was about US$30,000, the S&P 500 2.97 times, the cumulative income in 10 years was about US$29,600, and the US Treasury bonds were 1.26 times, and the cumulative income in 10 years was only about US$12,600.
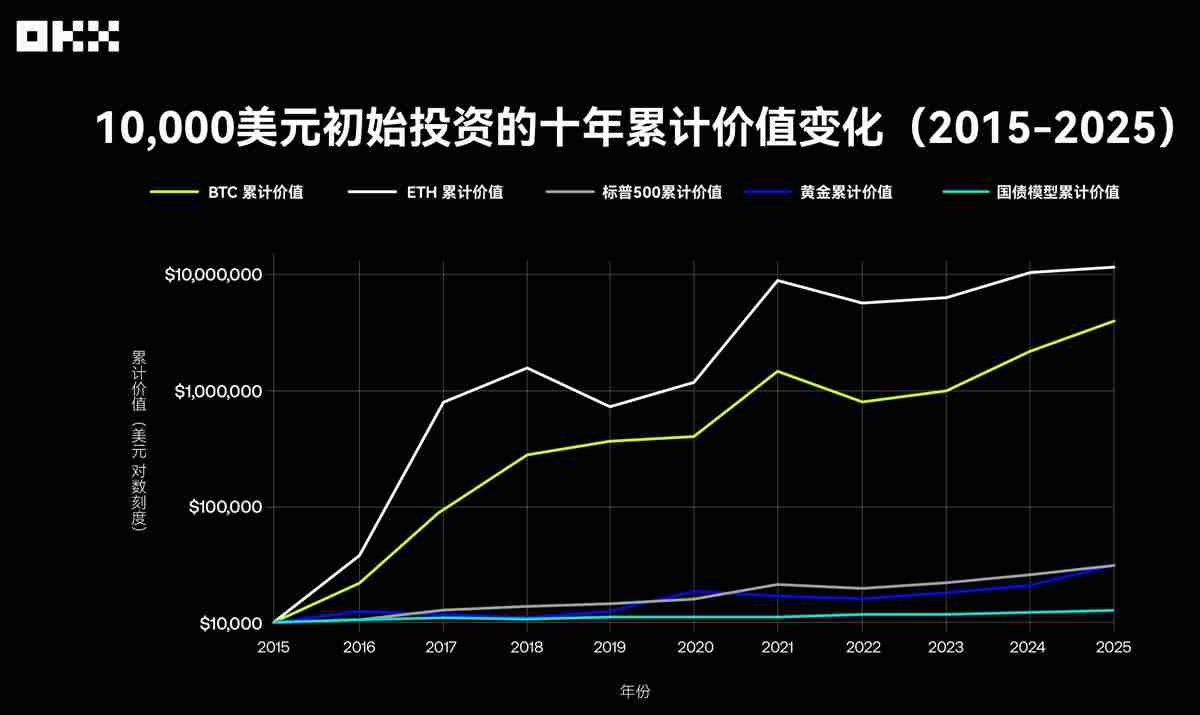
Among them, Bitcoin and Ethereum have shown an amazing wealth growth effect, with a return rate far exceeding traditional assets, reaching a hundred times or even a thousand times, reflecting the asymmetric return potential of emerging technology assets under high risks, which is unimaginable in the traditional financial world. In contrast, the S&P 500 has tripled its investment with stable compound interest growth, and gold has played a more valuable role. After fully experiencing low-interest and high-interest cycles, the U.S. Treasury bonds have almost stagnated for 10 years, highlighting the constraints of interest rate risks on the long-term performance of bond assets.
The maximum drawdown, how high is the risk behind the returns?
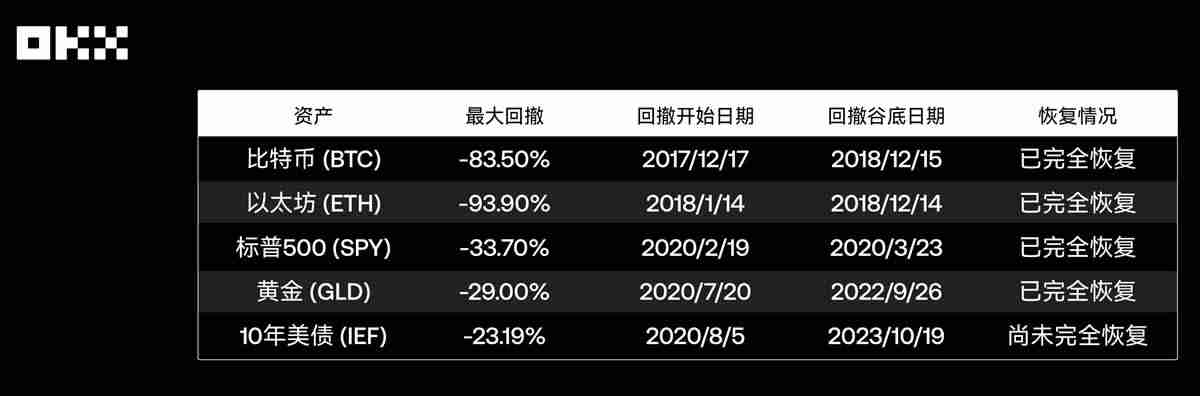
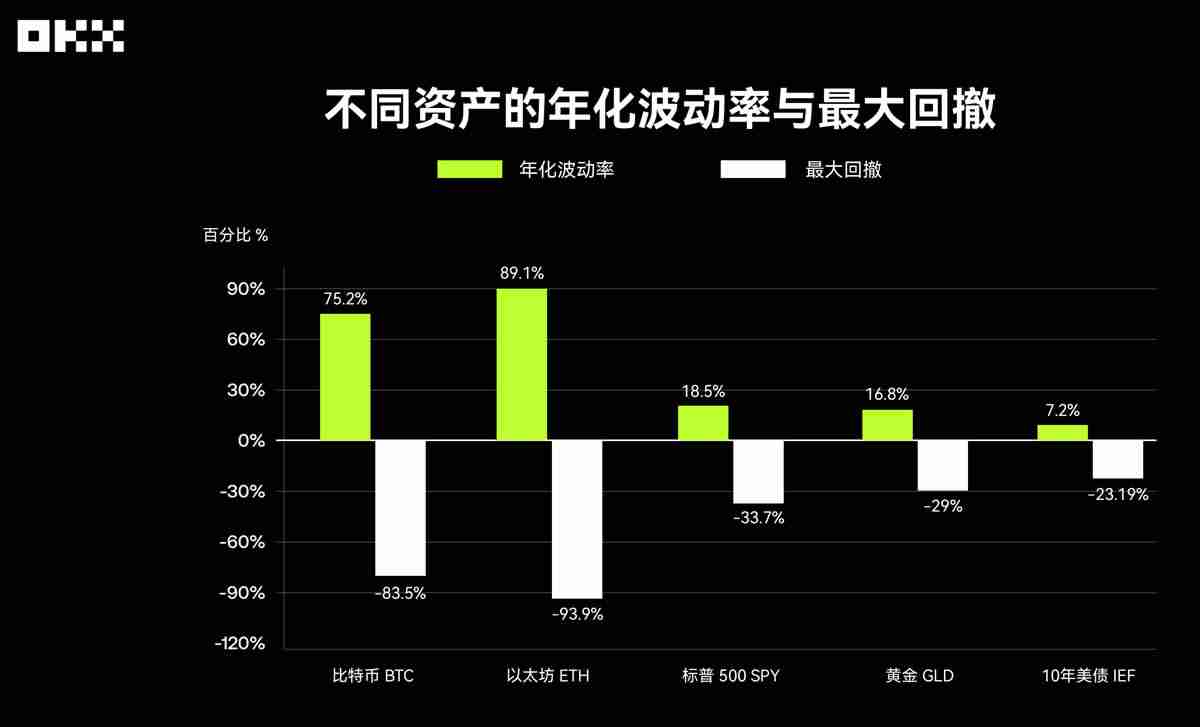
No asset can lead forever, and the rate of return is just the beginning of the story. A mature trading user is more concerned about the quality of returns—that is, how much risk they take, so understanding the risk characteristics of different assets is as important as understanding their return potential. Through the three core indicators of volatility, maximum drawdown and Sharpe ratio, the true "cost-performance ratio" of various assets can be more comprehensively evaluated. Volatility is usually measured in standard deviations, reflecting the volatility of asset prices. The maximum drawdown measures the maximum decline of an asset from its historical highest point to its subsequent lowest point. It is an intuitive indicator for measuring downside risks, which is directly related to the psychological endurance limit of trading users and the ability of asset portfolios to survive.
Data source: Bloomberg, S&P Global, Yahoo Finance, etc.
The volatility of crypto assets is far greater than that of traditional assets. According to Digital One Agency, Bitcoin’s annualized standard deviation is about 70%-90%, while the S&P 500 index is only 15%-20%. This huge volatility directly leads to the astonishing largest drawdown: Bitcoin and Ethereum have experienced multiple deep drawdowns of more than 70% over the past 10 years. For example, in the 2018 bear market, the price of BTC fell from nearly $20,000 to about $3,000, with a drawdown of more than 80%. The largest retracement of the S&P 500 occurred in the early stages of the COVID-19 epidemic in 2020, at about -34%. During the 2008 financial crisis in history, the drawdown exceeded 50%. Gold has performed relatively stably, with the largest drawdown in the past 15 years being about -29%. As a safe-haven asset, U.S. Treasury bonds have the smallest drawdown, but due to the interest rate cycle, they also experienced a maximum drawdown of about -23% in the interest rate hike cycle after 2020, breaking its "risk-free" myth.
This data is alarming. Users of Bitcoin and Ethereum must be able to withstand more than 80% or even 90% of asset shrinkage, and need to wait more than two to three years to unwind.
In addition, to comprehensively assess risk and benefit, we also introduced Sharpe ratio and Kama ratio. The Sharp ratio was proposed by Nobel Prize winner William Sharp and is the most classic risk-adjusted return indicator in the world. It measures how much excess returns a user can get beyond the risk-free interest rate for every additional unit of total risk-free risk. The higher the Sharpe ratio, the better the return performance of the asset and the higher the trading efficiency when taking the same risks.
The Kama ratio is another important risk-adjusted return indicator, but it focuses more on measuring downside risks of assets. Its calculation method is the ratio of the annualized rate of return to the largest historical retracement. The higher the Kama ratio, the stronger the "recovery ability" or "cost-performance ratio" of the assets when they withstand the worst drawdown in history. This indicator is particularly favored by users who focus on risk control.
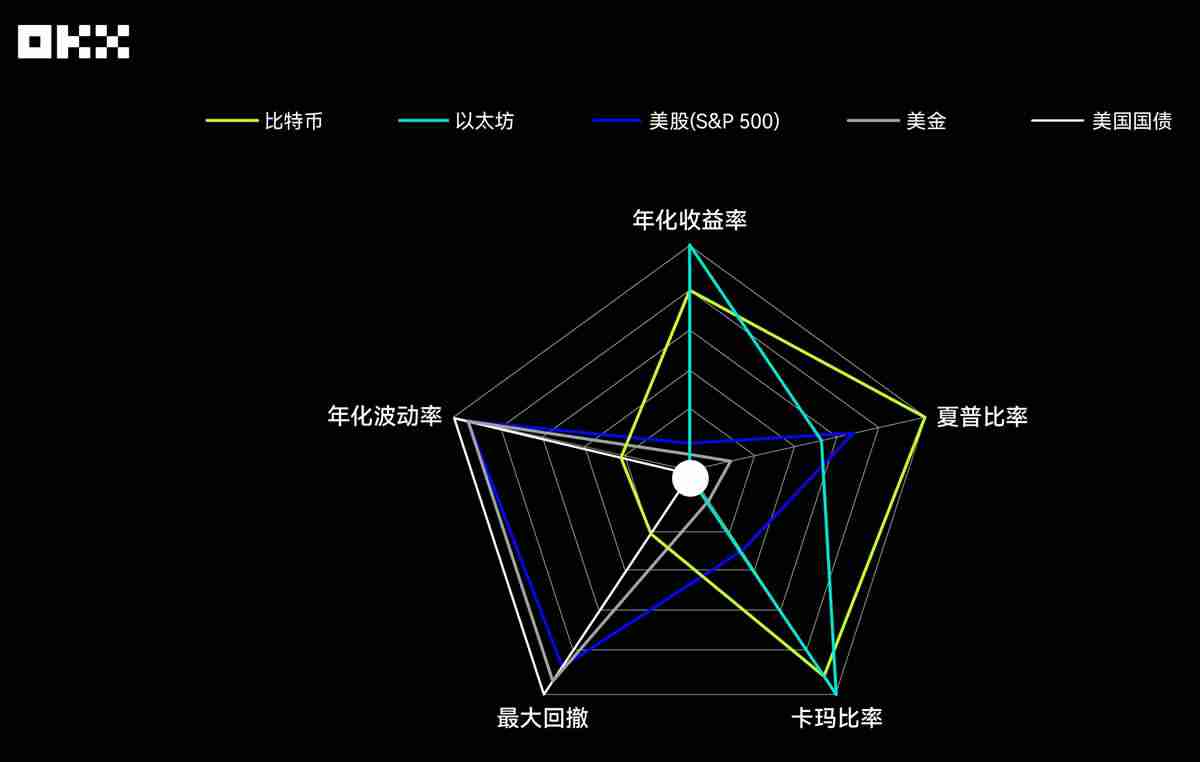
Bitcoin and Ethereum have the most "radical" radar graphics. They show unparalleled advantages in the two dimensions of annualized yield and kama ratio, forming two outward sharp corners, reflecting their amazing wealth growth effects and strong post-retracement recovery capabilities over the past decade. However, this high return is not without its price. In both the maximum retracement and annualized volatility, their scores are the lowest among all assets, which means that their graphs are severely retracted in these two directions, forming a clear "shortcoming". This clearly reveals the high risk and high volatility of crypto assets. It is worth noting that Bitcoin’s Sharpe ratio performs better than Ethereum, indicating that Bitcoin’s investment efficiency is slightly better after the risk adjustment.
The radar chart of the US stock market (S&P 500) presents a relatively balanced pentagon with considerable coverage area. It has no obvious shortcomings and no extreme strengths in all five dimensions. Its Sharpe ratio is outstanding, second only to Bitcoin, showing excellent risk-adjusted returns. At the same time, its annualized yield is stable, while volatility and maximum drawdown are properly controlled, far better than crypto assets. This portrays a typical image of "backbone": it can not only provide considerable long-term returns, but also control risks within a relatively reasonable range, and is the cornerstone of building an asset portfolio.
The radar graph shape of gold tends to be risk control dimensions. Its high scores in annualized volatility and maximum retracement, indicating that its price is relatively stable and has strong resistance to declines. However, gold's performance is relatively mediocre in the three income-related dimensions of annualized yield, Sharpe ratio and Kama ratio. This is exactly in line with gold's positioning as a traditional safe-haven asset: it is not a tool for pursuing high growth, but rather a function of providing store of value and hedging risks in the event of market turmoil. Its small graph area also reflects its lower overall profit efficiency.
The radar chart of US Treasury bonds is the smallest of all assets, with a shape that shrinks in the center. It scores the highest score on the two risk dimensions of annualized volatility and maximum retracement, showing extremely strong stability. However, it scores at the bottom on all earnings-related dimensions. This clearly shows that in the macro context of interest rate declines in the past decade, US Treasury bonds have mainly played the role of capital preservation and liquidity, and are the "ballast stone" in the asset portfolio, not the return engine. Its extremely low risks and extremely low returns form a sharp contrast.
Correlation between assets, how to optimize asset portfolio?
The core of asset portfolio diversification lies in the inclusion of assets with low correlation. When one asset falls, the other asset may rise or remain stable, thus smoothing out the volatility of the entire asset portfolio. At the beginning of the birth of Bitcoin, it had almost no correlation with traditional financial markets and was regarded as a perfect "decentralization tool". However, this characteristic has changed significantly over the past decade, especially after the accelerated institutionalization process.
The correlation coefficient measures the degree of change in the same direction of the price of two assets, ranging from -1 (fully negative correlation) to 1 (fully positive correlation). An effective diversified asset portfolio, usually composed of low-correlation or negative-correlation assets. The following table combines data from multiple research institutions and shows the approximate correlations between assets over the past decade.
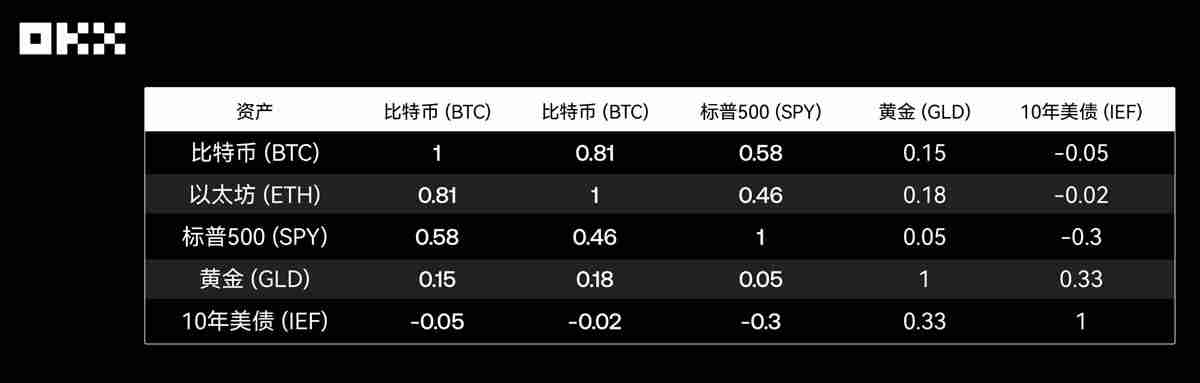
Source: Crypto Research Report, LSEG, Newhedge
Bitcoin vs S&P 500: From standalone to synchronous. This is one of the most important changes in the decade. Before 2020: The correlation between crypto assets and traditional assets is generally low and unstable, often fluctuating between positive and negative, showing strong independence. 2020-2021: During the epidemic and monetary easing period, with the global central banks adopting large-scale liquidity injection, the "water rise and high" effect of all risky assets is significant. During this period, the correlation between Bitcoin and S&P 500 (especially technology stocks) rose sharply, once exceeding 0.6, showing a strong "coupling". This shows that in a macro liquid-driven market, Bitcoin is more like a high-beta risk asset than a hedge tool.
2022-2023: Rate hikes and tightening cycles. As the Federal Reserve starts an aggressive rate hike cycle, risky assets are generally under pressure. The correlation between Bitcoin and the S&P 500 remains at a high level and falls together. However, its negative correlation with the US dollar index (DXY) has significantly enhanced, and Bitcoin prices tend to be under pressure as the US dollar strengthens. 2024-2025: In the ETF era, the approval of the US spot Bitcoin ETF is regarded as a structural turning point. On the one hand, it strengthens the connection between the crypto market and the traditional financial system; on the other hand, the continuous inflow of capital brought by ETFs may also become a pricing factor independent of macro sentiment, resulting in a change in correlation again. Data shows that after the ETF is approved, the correlation between Bitcoin and the S&P 500 has decreased, showing certain signs of "decoupling".
Bitcoin vs Gold: The Challenge of the "Digital Gold" Narrative. Although Bitcoin is known as "digital gold" for its fixed supply, data shows that it is not stable with the hedge attributes and correlations of real gold. Research by the European Securities and Markets Authority (ESMA) points out that there is no clear stable relationship between the two, especially when market panic, Bitcoin tends to fall along with risky assets rather than providing shelter like gold.
Traditional internal relationships: The classic negative or low correlation between gold, US Treasury bonds and the S&P 500 remains the cornerstone of traditional asset allocation and provides important stability for asset portfolios.
How has the performance of the five major assets been affected by major events?
The average over a long period may mask extreme performance at critical moments. By "slicing" analysis of several major events, we can have a deeper understanding of the true "stress response" of various assets.
(I) March 2020: COVID-19 black swan event, undifferentiated selling of global markets in the world
In March 2020, the COVID-19 epidemic triggered panic in the global financial market, known as "Black March" in history. In this extreme liquidity crisis, almost all assets were sold out indiscriminately. The S&P 500 fell into a bear market in just 16 trading days, setting a record for the fastest in history, with the largest drawdown reaching -34%. Bitcoin was also not spared, with prices plummeting nearly 50% in one day on March 12, from about $8,000 to below $4,000. Gold (GLD) has also failed to be completely spared, and fell in the short term as users sell their assets in exchange for US dollar liquidity. Only US Treasury bonds are the ultimate haven, and the prices are strong. This incident deeply reveals that in the extreme "risk removal" stage, the correlation will converge to 1, and Bitcoin's "digital risk aversion" narrative is vulnerable to liquidity exhaustion.
(II) May & November 2022: Encrypted native crisis, LUNA&FTX collapse brings a devastating blow
2022 is a "disaster year" for the crypto industry. In May, the collapse of the algorithmic stablecoin TerraUSD (UST) and its sister token LUNA wiped out nearly $50 billion in market value in a few days. In November of the same year, the sudden bankruptcy of FTX, the world's second largest crypto exchange, further exacerbated the market's panic. These two events are typical crypto-endogenic crisis. Research shows that after the FTX crash, both Bitcoin and Ethereum prices fell by more than 20%, while assets closely related to the FTX ecosystem fell even more. However, in these events, the traditional financial markets of gold, S&P, and US debt were almost unaffected, clearly demonstrating the risk isolation between the crypto market and traditional finance. This suggests that crypto assets face not only macroeconomic risks, but also unique and potentially more devastating internal protocols, platforms and trust risks.
(III) 2020-2025: Macropolistic policy shifts to cycle, the tide of liquidity
The Federal Reserve's monetary policy is the "total valve" of global liquidity. Under the large-scale quantitative easing and zero-interest rate policies from 2020 to 2021, abundant liquidity poured into risky assets, and both Bitcoin and S&P 500 ushered in a bull market. However, since the Fed started a radical interest rate hike cycle in March 2022 to combat inflation, global liquidity has tightened and risky asset prices have fallen. Academic research shows that Bitcoin prices’ sensitivity to Fed rate decisions and monetary policy uncertainty (MPU) has increased significantly after 2020. This once again confirms that Bitcoin has been deeply integrated into the macro-financial framework, and its price fluctuations are closely linked to the Fed's policy expectations.
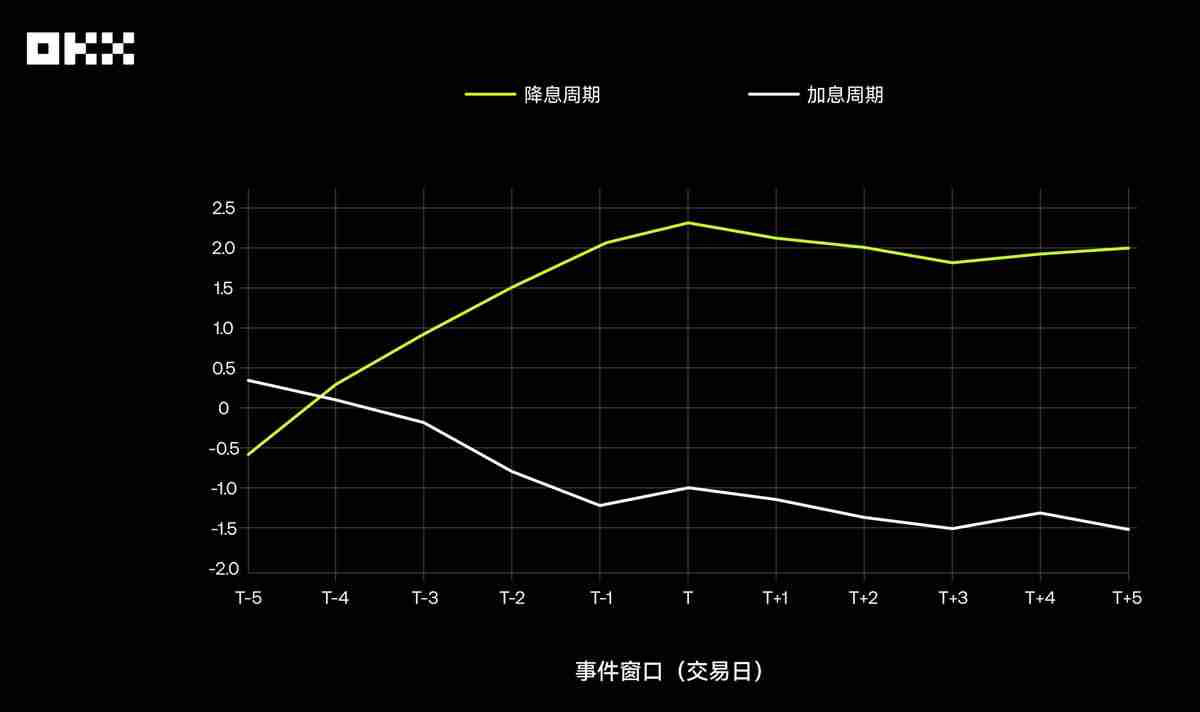
In addition, the research found that the Bitcoin market showed significant "expected transactions" characteristics. Before the announcement of the interest rate hike resolution, the market often had digested the expectation of interest rate hikes, and Bitcoin price was under pressure in advance; while when the expectation of interest rate cuts was strong, the price would rise in advance. On the day the resolution is announced, if the results meet expectations, the market usually has little reaction. The real violent fluctuations come from "interest rate accidents" - that is, the FOMC's decisions deviate from the market's expectations of pricing through tools such as interest rate futures.
The figure below shows the average cumulative excess returns (CAR) of Bitcoin relative to the S&P 500 during the rate hike and rate cut event window (T-5 to T5 days). It can be seen that during the interest rate cut cycle, Bitcoin had significant positive excess returns before the resolution was announced, while in the interest rate hike cycle, it was not obvious or even negative. This shows that the market's response to rate cuts is more positive and advanced.
(IV) January 2024: Bitcoin spot ETF is approved, a milestone leading to the mainstream
On January 10, 2024, the U.S. Securities and Exchange Commission (SEC) formally approved the listing of the first batch of Bitcoin spot ETFs, which is regarded as a milestone in the legalization and mainstreaming of crypto assets. The launch of ETFs has greatly lowered the threshold for traditional users to access Bitcoin. Data shows that after the ETF was approved, Bitcoin trading volume soared and capital inflows were strong. Chainalysis' chart shows that after the launch of the ETF, its daily trading volume once approached $10 billion in March, and its cumulative capital inflow rate far exceeded the performance of the first gold ETF in 2005. This event not only drove Bitcoin price to a new high, but more importantly, it is structurally changing Bitcoin’s user base and market dynamics, making its connection with the traditional financial system unprecedentedly close.
Without perfect assets, build a portfolio of assets that travel through cycles
BTC/ETH is the undisputed "king of growth" of the past decade, providing extremely high returns that no traditional asset can match. However, the price of this return is extreme volatility and significant drawdowns. Its relevance to traditional markets is increasing, weakening its value as a purely decentralized tool. It is suitable for users with extremely high risk tolerance and long-term holding beliefs.
The S&P 500 is the "ballast stone" of long-term asset portfolios. It provides excellent, sustainable CAGR and shows the best balance both Sharpe and Kama ratios after risk adjustment. Although it will experience a periodic pullback, its strong recovery ability and the support of the real economy behind it make it the absolute core of building an asset portfolio.
As an ancient store of value, gold has limited absolute returns, but it is still an indispensable "insurance policy" when macro uncertainty, geopolitical risks and credit monetary system are questioned. Its value in the portfolio is not offense, but defense.
The status of US Treasury bonds as a traditional "safe harbor" has been severely challenged in the unprecedented interest rate hike cycle, reminding users that "risk-free" is just a relative concept. Nevertheless, it is still one of the world's best liquid and highest credit rating assets, and the basic role of providing stability and liquidity in the asset portfolio is difficult to replace in the short term.
Therefore, this classic question has an answer: choose a fixed investment strategy or a one-time investment strategy?
In the long run, fixed investment strategies show huge advantages for high volatility assets (BTC/ETH). By buying more shares at the price trough, fixed investment effectively smooths the cost, reduces timing risks, and ultimately obtains very considerable returns, and the psychological pressure in the process is much less than one-time investment;
For Steady Growth Assets (SPY), due to the long-term upward stock market, the one-time investment strategy has performed better than the fixed investment strategy for most of the time in history because it allows funds to enjoy the compound growth of the market earlier and more fully.
For low-growth assets (GLD/IEF), the final results of the two strategies are not very different, and neither of them can bring explosive returns. The conclusion is that fixed investment is an effective strategy to control highly volatile assets such as Bitcoin, and for long-term and steady growth equity markets, it is usually a better choice to invest one-time as soon as possible. Whether you prefer basic fixed investment strategies, intelligent arbitrage strategies, grid strategies suitable for short-term, or advanced signal or iceberg strategies, OKX strategy trading can meet your needs in one stop.
The "Holy Grail" of asset allocation is not to find a single best asset, but to deeply understand and cleverly combine the unique character of different assets. A solid asset portfolio should use the sharpness of crypto assets to gain excess returns, rely on the thickness of equity assets to drive long-term growth, and allocate the stability of gold and bonds to resist unknown risks. 10 years of data tell us: the market is always evolving, and there is no eternal winner. The true "king of assets" may not exist in a specific asset, but in a rational trading framework that can deeply understand and control the characteristics of different assets.
The above is the detailed content of Looking back on the performance of mainstream assets in 10 years: From Bitcoin to US Treasury, who is the king of income?. For more information, please follow other related articles on the PHP Chinese website!

Hot AI Tools

Undress AI Tool
Undress images for free

Undresser.AI Undress
AI-powered app for creating realistic nude photos

AI Clothes Remover
Online AI tool for removing clothes from photos.

ArtGPT
AI image generator for creative art from text prompts.

Stock Market GPT
AI powered investment research for smarter decisions

Hot Article
Hot Tools

Notepad++7.3.1
Easy-to-use and free code editor

SublimeText3 Chinese version
Chinese version, very easy to use

Zend Studio 13.0.1
Powerful PHP integrated development environment

Dreamweaver CS6
Visual web development tools

SublimeText3 Mac version
God-level code editing software (SublimeText3)

 How to set the taskbar clock to the second in win11_How to set the seconds displayed in the win11 taskbar clock
Oct 14, 2025 am 11:21 AM
How to set the taskbar clock to the second in win11_How to set the seconds displayed in the win11 taskbar clock
Oct 14, 2025 am 11:21 AM
Windows 11 can enable the taskbar clock to display seconds through settings, registry, command line, or third-party tools. 1. Turn it on in settings: Go to Personalization → Taskbar → Taskbar Behavior and turn on "Show seconds in system tray clock"; 2. Registry modification: Create a new DWORD value ShowSecondsInSystemClock under HKEY_CURRENT_USER\SOFTWARE\Microsoft\Windows\CurrentVersion\Explorer\Advanced and set it to 1; 3. Command line execution: Run PowerShell as an administrator and enter regaddHKCU\Softw
 How to set up screen tearing when playing games in win11_Win11 game screen tearing repair and setting tutorial
Oct 14, 2025 am 11:18 AM
How to set up screen tearing when playing games in win11_Win11 game screen tearing repair and setting tutorial
Oct 14, 2025 am 11:18 AM
Screen tearing is caused by the graphics card frame rate being out of sync with the monitor refresh rate, which can be solved by enabling windowed optimization, turning off full-screen optimization, setting vertical sync, calibrating the refresh rate, and turning off automatic HDR.
 What to do if windows11 cannot install net framework 3.5_How to fix the failure of windows11 to install .NET 3.5
Oct 14, 2025 am 11:09 AM
What to do if windows11 cannot install net framework 3.5_How to fix the failure of windows11 to install .NET 3.5
Oct 14, 2025 am 11:09 AM
First, use the DISM command to install .NET Framework 3.5 from local sources. If it fails, enable the function through the control panel, then repair the system files and reset the update service, check the group policy settings, and finally use third-party tools to assist in the repair.
 How to solve the green screen or black screen when playing video in edge browser_How to solve the green screen and black screen when playing video in edge browser
Oct 14, 2025 am 10:42 AM
How to solve the green screen or black screen when playing video in edge browser_How to solve the green screen and black screen when playing video in edge browser
Oct 14, 2025 am 10:42 AM
First, adjust the hardware acceleration settings, close and then restart the Edge browser; second, update or reinstall the graphics card driver to improve compatibility; then clear the GPUCache folder in the ShaderCache; and finally, reset the browser settings to eliminate abnormalities.
 How does Google Chrome manage website location information permissions_How to manage website location permissions in Google Chrome
Oct 15, 2025 am 11:09 AM
How does Google Chrome manage website location information permissions_How to manage website location permissions in Google Chrome
Oct 15, 2025 am 11:09 AM
1. Website location permissions can be managed through Google Chrome settings: First click the three-dot menu to enter "Settings", select "Website Settings" under "Privacy and Security", and adjust the default behavior in "Location Information" to globally prohibit or allow access; 2. For specific websites, click the lock icon in the address bar and enter "Site Settings" to configure location permissions individually; 3. If you need to clear historical authorization records, you can delete website data including location permissions through the "Clear Browsing Data" function and reset all permission settings.
 What should I do if the web text highlighting function of Google Chrome cannot be used?
Oct 13, 2025 am 10:58 AM
What should I do if the web text highlighting function of Google Chrome cannot be used?
Oct 13, 2025 am 10:58 AM
Chrome 131 version has a known bug in which text highlighting fails. It mainly affects websites that use TailwindCSS. It can be solved by updating to version 131.0.6778.86 or above and restarting the browser. If the problem still exists, you need to troubleshoot extensions or website style conflicts. If necessary, clear browsing data or check theme settings.
 What to do if win10 printer connection error 0x00000709_Win10 printer connection error repair method
Oct 13, 2025 am 11:44 AM
What to do if win10 printer connection error 0x00000709_Win10 printer connection error repair method
Oct 13, 2025 am 11:44 AM
Error code 0x00000709 usually causes shared printer connection failure due to insufficient permissions, system update conflicts, or service abnormalities. You can use professional tools to repair it with one click, or solve this problem by modifying registry permissions, uninstalling specific updates such as KB5005569, restarting PrintSpooler and related services, and adding Windows credentials (such as IP address and guest account).
 How to set the default audio device in Windows_How to set the default audio playback and recording device in Windows
Oct 14, 2025 am 11:24 AM
How to set the default audio device in Windows_How to set the default audio playback and recording device in Windows
Oct 14, 2025 am 11:24 AM
First, change the default playback device through the system sound settings, right-click the volume icon and select Sound Settings, select the target device in the output options and test; then set the default microphone in the recording tab of the sound control panel, right-click the required device and set it as the default; you can also use third-party tools such as AudioSwitch to quickly switch input and output devices; advanced users can use the nircmd command line tool to achieve automatic switching, and use the setdefaultsounddevice command to specify the playback or recording device.