Found a total of 10000 related content
PHP environment configuration: debugging tools and extension installation
Article Introduction:Xdebug is the core tool of PHP debugging, and can achieve breakpoint debugging with IDE; lightweight tools such as var_dump(), error_log() and Laravel's dd() are suitable for simple troubleshooting. The installation method varies according to the system: Linux uses pecl or package manager, macOS uses brew, and Windows enables dll files. Key configurations include enabling error reporting, setting log paths, IDE port synchronization, and using browser plug-ins to assist debugging. Ignoring these details may cause debugging failures.
2025-06-27
comment 0
697

Frontend Debugging Techniques and Tools
Article Introduction:Common methods and tools for front-end debugging include: 1. Use browser developer tools to troubleshoot basic problems, including viewing and modifying DOM structure, debugging JavaScript code, and viewing network request details; 2. Use console output and logs to track problems, such as using different levels of logs, grouping output, formatting output; 3. Use debugger breakpoints to deeply analyze, support single-step execution, entry of functions, and jumping out of functions; 4. Use special debugging auxiliary tools, such as ReactDeveloperTools, VueDevtools, Lighthouse, and ReduxDevTools. Mastering these techniques can effectively improve debugging efficiency and code quality.
2025-07-24
comment 0
599
10 JavaScript Online and Browser-based Debugging Tools
Article Introduction:Ten online and browser-side JavaScript debugging tools recommended
Debugging JavaScript code is sometimes the most painful part of web development. Therefore, we have collected some excellent JavaScript debugging tools. The following lists 10 online and browser debugging tools, hoping to help you! Related Readings: - Easy Guide to Installing and Using Firebug - Ten Tips for Mastering Firebug Console
Online debugging tools
1. Pastebin
Pastebin is a collaborative debugging tool that allows you to share and modify code snippets and chat on IRC, IM or message boards.
Source code and demonstration ### 2. JSON formatting and validator
J
2025-02-28
comment 0
786
Mastering JavaScript Debugging: Tools and Techniques for Bug-Free Code
Article Introduction:JavaScript Debugging Tools
Debugging is an essential skill for every JavaScript developer. It involves identifying and resolving issues or bugs in code. Modern tools provide powerful features to simplify debugging, improve code quality, and str
2024-12-20
comment 0
924

6 Tools for Debugging React Native
Article Introduction:Key Takeaways
Debugging is a crucial part of software development, helping to identify and fix problems before they’re pushed to production. In the React Native world, there are several tools available for debugging, each suited to different envir
2025-02-10
comment 0
389

CSS Debugging and Optimization: Browser-based Developer Tools
Article Introduction:Mastering CSS: A Guide to Browser-Based Developer Tools for Debugging and Optimization
This excerpt from Tiffany's CSS Master, 2nd Edition, explores essential tools for troubleshooting and optimizing your CSS. Learn how to diagnose rendering problem
2025-02-10
comment 0
837
Debugging Python Code Effectively with Tools
Article Introduction:The methods of debugging Python code mainly include: 1. Use pdb for command line debugging; 2. Use the graphical debugging function of the IDE; 3. Record logs through the logging module; 4. Use third-party debugging tools. pdb is a debugger built into Python. You can insert pdb.set_trace() into the code or start it through the command line to perform single-step execution, view variables, etc.; IDEs such as PyCharm and VSCode provide graphical interface debugging functions such as breakpoints and monitoring expressions, which are suitable for complex logic problems; the logging module can replace print output, support multi-level control and diversified output targets, which are convenient for log management at different stages; ipdb, Py-Spy, c
2025-07-07
comment 0
904

What tools are available for debugging Go applications (e.g., Delve)?
Article Introduction:The main tool for debugging Go applications is Delve (dlv), which is specially designed for Go, supports setting breakpoints, variable checking, remote debugging, and integrates with IDEs such as VSCode and GoLand; other tools include 1. GDB (basic debugging but limited functions) 2. Print logs (simple and effective) 3. pprof (analyzing performance problems) 4. Trace tool (viewing execution events); most modern editors such as VSCode and GoLand can achieve Delve-based debugging integration through plug-ins.
2025-06-12
comment 0
295

What Are the Key Features of Docker's Built-in Testing and Debugging Tools?
Article Introduction:Docker's built-in tools enhance application testing and debugging by offering features like Docker Compose for multi-container testing, logs for real-time diagnostics, exec for interactive debugging, health checks, diff for file system changes, and i
2025-03-14
comment 0
1173
What are the different debugging tools available for Python (e.g., pdb, IDE debuggers)?
Article Introduction:There are many options for Python debugging tools, suitable for different scenarios. 1. The command line debugger pdb is a standard debugging library built into Python, suitable for basic debugging needs. It can be enabled by inserting code using importpdb or breakpoint(), and supports breakpoints, single-step execution and other operations; 2. The IDE's own debuggers such as PyCharm and VSCode provide graphical interfaces, which support clicking to set breakpoints, view variables, conditional breakpoints and other functions, which are more suitable for use when developing complex projects; 3. Third-party debugging tools include ipdb (combined with IPython to enhance interactive experience), pudb (terminal visual debugging) and py-spy (performance analysis). They need to be installed first to optimize different debugging needs.
2025-06-28
comment 0
1018

Debugging HTML with Browser Developer Tools
Article Introduction:The key to debugging HTML application browser developer tools is to master several core functions. 1. Use the "check" function to view the DOM structure to confirm whether the elements exist and whether the tags are nested correctly; 2. Edit HTML and CSS in real time, test the modification effect and check style conflicts; 3. Use the box model panel to check layout parameters such as margin, border, padding; 4. Set breakpoints or listen for DOM changes to track the dynamic modification of JavaScript. Proficient in using these methods can efficiently locate and solve common problems in HTML debugging.
2025-07-19
comment 0
614
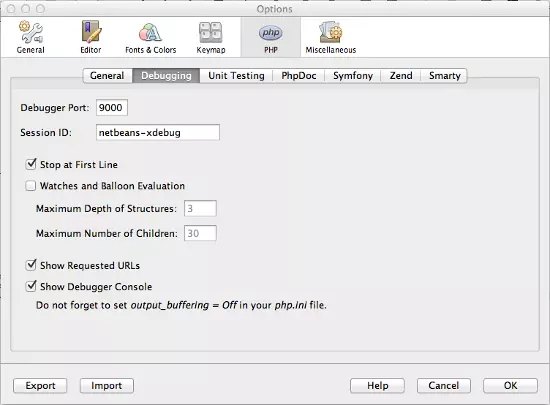
PHP Master | Debugging and Profiling PHP with Xdebug
Article Introduction:Xdebug: Powerful debugging and performance analysis tools for PHP developers
Core points:
Xdebug is a powerful, free and open source PHP extension that provides debugging support, stack trace, performance analysis, code coverage and other functions. It allows developers to pause the execution of the application at any time and check the value of variables to better understand how PHP is running.
Xdebug can be used as a performance analysis tool for PHP applications, recording important details such as statements and functions execution time and number of calls. Analyzing these outputs allows you to understand where the bottleneck lies, thereby optimizing your application for performance.
To use Xdebug, it needs to be installed and configured correctly. XAMPP or MAMP is pre-installed with XDEbug.
2025-02-25
comment 0
1067
Debugging PHP Code Effectively with Temporary Comments
Article Introduction:Troubleshooting PHP code problems with temporary annotations is an efficient way, especially when debugging tools are lacking. 1. Reduce the scope of the problem by commenting large segments of logic, and gradually relax the observation of behavior changes; 2. Comment the subsequent interfering code, focus on testing variable values, and avoid being affected by redundant logic; 3. Use comments instead to delete function calls, retain structure and test process changes, such as the replacement conditions are judged as fixed values; 4. Pay attention to avoid dependency errors caused by nesting multi-layer comments and be careful about annotation database operations, and manage changes with the help of version control tools. Mastering these techniques can significantly improve debugging efficiency.
2025-07-16
comment 0
166
Using Comments for Debugging PHP
Article Introduction:When debugging PHP code, the rational use of annotation control debug information can avoid interfering with the output and exposing sensitive data. 1. Use single-line comments to temporarily block debugging code, such as //echo'variable value'; to facilitate quick activation in the future; 2. Use if(false) condition to determine more flexible switching control to improve debugging efficiency; 3. Be careful not to submit comment debugging code to the production environment, avoid syntax errors caused by nested comments, and use IDE shortcut keys to improve operation efficiency. These methods can effectively optimize the debugging process and reduce the risk of errors.
2025-07-18
comment 0
504

How to Use Xdebug for Debugging PHP 8 Applications?
Article Introduction:This article guides PHP 8 developers on using Xdebug for debugging. It covers installation, configuration (including xdebug.mode, xdebug.client_port, xdebug.client_host), IDE integration, remote debugging, and troubleshooting. Optimal configurati
2025-03-10
comment 0
904
What are the PHP online runtime tools?
Article Introduction:There are several tools available for running PHP code directly on the Internet, including 3v4l.org, OnlinePHP.io, JDoodle, paiza.IO and Replit, which support quick testing of code snippets, debugging logic, learning new features and sharing code. 1.3v4l.org is suitable for testing compatibility of different PHP versions; 2. OnlinePHP.io interface is simple, easy to run and view results directly; 3. JDoodle and paiza.IO support multilingual development; 4. Replit functions are comprehensive, suitable for testing complex projects. These tools are available without registration, but are not recommended to process sensitive data or connect to real databases. In addition, some platforms may limit execution time and memory
2025-06-27
comment 0
472

