

How to make a basic scatter plot using Python-Plotly?
Aug 31, 2023 pm 01:37 PM
Sometimes the task is to analyze a data set and visualize the data using charts or plots. Plotly is a great open source graphics library that can be used with Python for quickly and easily making a variety of plots and charts. In this article, you use two different examples to plot scatter plots using a Python library called Plotly with Python code. In the first example, the Python installed in the computer system is used to run a Python program written to make a scatter plot. Another example, using Google Colab, shows how you can still use Python and Plotly and make scatter plots without Python installed on your computer. In both examples, Kaggle's open source datasets were used for data analysis and visualization.
IRIS.csv file used
sepal_length,sepal_width,petal_length,petal_width,species
5.1,3.5,1.4,0.2,Iris-setosa
4.9,3,1.4,0.2,Iris-setosa
4.7,3.2,1.3,0.2,Iris-setosa
4.6,3.1,1.5,0.2,Iris-setosa
5,3.6,1.4,0.2,Iris-setosa
5.4,3.9,1.7,0.4,Iris-setosa
4.6,3.4,1.4,0.3,Iris-setosa
5,3.4,1.5,0.2,Iris-setosa
4.4,2.9,1.4,0.2,Iris-setosa
…….., ….., ……, ……., ……..
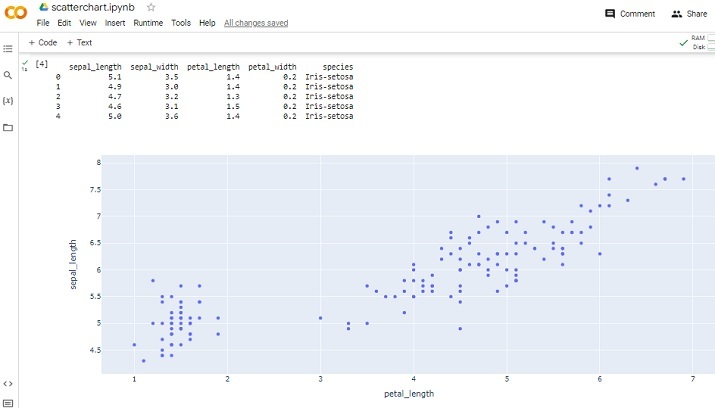
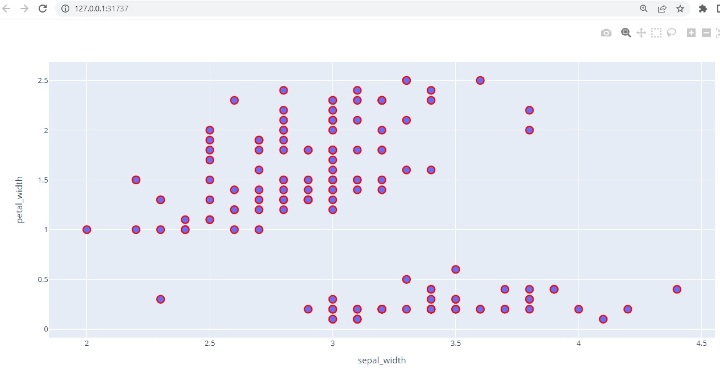
This CSV file contains five columns named sepal_length, sepal_width, petal_length, petal_width, and species. Among them, we will use sepal_width and petal_width as the scatter plot in example 1 and sepal_length and petal_length as the scatter plot in example 2.
Example 1: Making a Scatter Plot using Python and Plotly
Design steps and coding
Step 1 - First import pandas and draw. Plotly, an open source graphics library for Python, will be used to create scatter plots.
Step 2 - Now read the IRIS.csv file as the dataset given here will be used to make the scatter plot.
Step 3 - Make a data frame dff and display the columns and contents of the data frame.
Step 4 - Use the scatter() function to draw a scatter plot, specifying sepal_width for the x-axis and petal_width for the y-axis.
Step 5 - Set the style of the marker, such as size and color.
Step 6 - Write a function to display a scatter plot. Run the program using cmd window. The graph will open in a new tab in your browser.
Example 2: Making a scatter plot using Python and Plotly on Google Colab
Design steps and coding
Step 1 - Sign in with your Google Account. Go to Google Colab. Open a new Colab Notebook and write Python code in it.
Step 2 - Upload the IRIS.csv file downloaded and saved from Kaggle using the link given in Example 1 as the dataset given here will be used to make scatter points picture.
Step 3 - Now import pandas and plot. Plotly, an open source graphics library for Python, will be used to create scatter plots.
Step 4 - Make a data frame dff and display the columns and contents of the data frame.
Step 5 - Use the scatter() function to draw a scatter plot, specifying petal_length for the x-axis and sepal_length for the y-axis.
Step 6 - Write a function to display a scatter plot. Run the program by clicking the play button on a given code cell. Check the results as it will appear in the Colab notebook.
Example 1: Making a Scatter Plot using Python and Plotly
Save the data files/csv files required for data analysis
To make the scatter plot, we will use the data available on Kaggle. Log in to Kaggle and download the CSV file from this link -
Create a file named Scatter.py. Write the following code in this file
#include the required libraries
import pandas as pd

#This library is needed to make the scatter plot
import plotly.express as pxx

#read the CSV file and make a dataframe
dff = pd.read_csv("IRIS.csv")

#print the columns and data

print(dff.head())

#make the scatter plot
figg = pxx.scatter(dff, x="sepal_width", y="petal_width")

#set the properties of the scatter plot
figg.update_traces(marker=dict(size=12, line=dict(width=2, color="red")), selector=dict(mode='markers'))

#display the chart
figg.show()
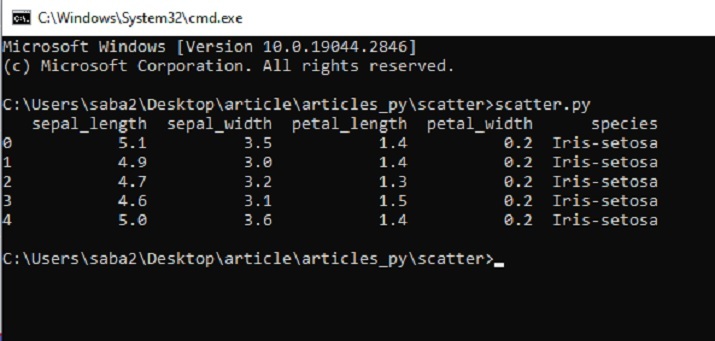
Run Python files in the command line window
View results - Example 1
Example 1: Making a scatter plot using Python on Google Colab
Upload data, CSV file
#Uploading the csv
from google.colab import dfiles
data_to_load = dfiles.upload()
Include libraries and read CSV files
import pandas as pdd
import plotly.express as pxx

dff = pdd.read_csv("IRIS.csv")
Print the results and display the scatter plot
print(dff.head())
figg = pxx.scatter(dff, x="petal_length", y="sepal_length")
figg.show()
View Results
In this Python and Plotly article, two different examples are given on how to make a scatter plot using a Python library called Plotly. First, the method of downloading and saving data sets from Kaggle for analysis is given. Then write a Python program to plot a scatter plot using functions in Plotly. In the second example, write a Python program using Google Colab and make a scatter plot using the same library and the same dataset.
The above is the detailed content of How to make a basic scatter plot using Python-Plotly?. For more information, please follow other related articles on the PHP Chinese website!

Hot AI Tools

Undress AI Tool
Undress images for free

Undresser.AI Undress
AI-powered app for creating realistic nude photos

AI Clothes Remover
Online AI tool for removing clothes from photos.

Clothoff.io
AI clothes remover

Video Face Swap
Swap faces in any video effortlessly with our completely free AI face swap tool!

Hot Article
Hot Tools

Notepad++7.3.1
Easy-to-use and free code editor

SublimeText3 Chinese version
Chinese version, very easy to use

Zend Studio 13.0.1
Powerful PHP integrated development environment

Dreamweaver CS6
Visual web development tools

SublimeText3 Mac version
God-level code editing software (SublimeText3)


 PHP calls AI intelligent voice assistant PHP voice interaction system construction
Jul 25, 2025 pm 08:45 PM
PHP calls AI intelligent voice assistant PHP voice interaction system construction
Jul 25, 2025 pm 08:45 PM
User voice input is captured and sent to the PHP backend through the MediaRecorder API of the front-end JavaScript; 2. PHP saves the audio as a temporary file and calls STTAPI (such as Google or Baidu voice recognition) to convert it into text; 3. PHP sends the text to an AI service (such as OpenAIGPT) to obtain intelligent reply; 4. PHP then calls TTSAPI (such as Baidu or Google voice synthesis) to convert the reply to a voice file; 5. PHP streams the voice file back to the front-end to play, completing interaction. The entire process is dominated by PHP to ensure seamless connection between all links.
 How to use PHP combined with AI to achieve text error correction PHP syntax detection and optimization
Jul 25, 2025 pm 08:57 PM
How to use PHP combined with AI to achieve text error correction PHP syntax detection and optimization
Jul 25, 2025 pm 08:57 PM
To realize text error correction and syntax optimization with AI, you need to follow the following steps: 1. Select a suitable AI model or API, such as Baidu, Tencent API or open source NLP library; 2. Call the API through PHP's curl or Guzzle and process the return results; 3. Display error correction information in the application and allow users to choose whether to adopt it; 4. Use php-l and PHP_CodeSniffer for syntax detection and code optimization; 5. Continuously collect feedback and update the model or rules to improve the effect. When choosing AIAPI, focus on evaluating accuracy, response speed, price and support for PHP. Code optimization should follow PSR specifications, use cache reasonably, avoid circular queries, review code regularly, and use X
 How to develop AI intelligent form system with PHP PHP intelligent form design and analysis
Jul 25, 2025 pm 05:54 PM
How to develop AI intelligent form system with PHP PHP intelligent form design and analysis
Jul 25, 2025 pm 05:54 PM
When choosing a suitable PHP framework, you need to consider comprehensively according to project needs: Laravel is suitable for rapid development and provides EloquentORM and Blade template engines, which are convenient for database operation and dynamic form rendering; Symfony is more flexible and suitable for complex systems; CodeIgniter is lightweight and suitable for simple applications with high performance requirements. 2. To ensure the accuracy of AI models, we need to start with high-quality data training, reasonable selection of evaluation indicators (such as accuracy, recall, F1 value), regular performance evaluation and model tuning, and ensure code quality through unit testing and integration testing, while continuously monitoring the input data to prevent data drift. 3. Many measures are required to protect user privacy: encrypt and store sensitive data (such as AES
 python seaborn jointplot example
Jul 26, 2025 am 08:11 AM
python seaborn jointplot example
Jul 26, 2025 am 08:11 AM
Use Seaborn's jointplot to quickly visualize the relationship and distribution between two variables; 2. The basic scatter plot is implemented by sns.jointplot(data=tips,x="total_bill",y="tip",kind="scatter"), the center is a scatter plot, and the histogram is displayed on the upper and lower and right sides; 3. Add regression lines and density information to a kind="reg", and combine marginal_kws to set the edge plot style; 4. When the data volume is large, it is recommended to use "hex"
 How to use PHP combined with AI to analyze video content PHP intelligent video tag generation
Jul 25, 2025 pm 06:15 PM
How to use PHP combined with AI to analyze video content PHP intelligent video tag generation
Jul 25, 2025 pm 06:15 PM
The core idea of PHP combining AI for video content analysis is to let PHP serve as the backend "glue", first upload video to cloud storage, and then call AI services (such as Google CloudVideoAI, etc.) for asynchronous analysis; 2. PHP parses the JSON results, extract people, objects, scenes, voice and other information to generate intelligent tags and store them in the database; 3. The advantage is to use PHP's mature web ecosystem to quickly integrate AI capabilities, which is suitable for projects with existing PHP systems to efficiently implement; 4. Common challenges include large file processing (directly transmitted to cloud storage with pre-signed URLs), asynchronous tasks (introducing message queues), cost control (on-demand analysis, budget monitoring) and result optimization (label standardization); 5. Smart tags significantly improve visual
 PHP integrated AI emotional computing technology PHP user feedback intelligent analysis
Jul 25, 2025 pm 06:54 PM
PHP integrated AI emotional computing technology PHP user feedback intelligent analysis
Jul 25, 2025 pm 06:54 PM
To integrate AI sentiment computing technology into PHP applications, the core is to use cloud services AIAPI (such as Google, AWS, and Azure) for sentiment analysis, send text through HTTP requests and parse returned JSON results, and store emotional data into the database, thereby realizing automated processing and data insights of user feedback. The specific steps include: 1. Select a suitable AI sentiment analysis API, considering accuracy, cost, language support and integration complexity; 2. Use Guzzle or curl to send requests, store sentiment scores, labels, and intensity information; 3. Build a visual dashboard to support priority sorting, trend analysis, product iteration direction and user segmentation; 4. Respond to technical challenges, such as API call restrictions and numbers
 How to develop AI-based text summary with PHP Quick Refining Technology
Jul 25, 2025 pm 05:57 PM
How to develop AI-based text summary with PHP Quick Refining Technology
Jul 25, 2025 pm 05:57 PM
The core of PHP's development of AI text summary is to call external AI service APIs (such as OpenAI, HuggingFace) as a coordinator to realize text preprocessing, API requests, response analysis and result display; 2. The limitation is that the computing performance is weak and the AI ecosystem is weak. The response strategy is to leverage APIs, service decoupling and asynchronous processing; 3. Model selection needs to weigh summary quality, cost, delay, concurrency, data privacy, and abstract models such as GPT or BART/T5 are recommended; 4. Performance optimization includes cache, asynchronous queues, batch processing and nearby area selection. Error processing needs to cover current limit retry, network timeout, key security, input verification and logging to ensure the stable and efficient operation of the system.
 python list to string conversion example
Jul 26, 2025 am 08:00 AM
python list to string conversion example
Jul 26, 2025 am 08:00 AM
String lists can be merged with join() method, such as ''.join(words) to get "HelloworldfromPython"; 2. Number lists must be converted to strings with map(str, numbers) or [str(x)forxinnumbers] before joining; 3. Any type list can be directly converted to strings with brackets and quotes, suitable for debugging; 4. Custom formats can be implemented by generator expressions combined with join(), such as '|'.join(f"[{item}]"foriteminitems) output"[a]|[
