How can you monitor the resource usage of a Docker container?
Jun 13, 2025 am 12:10 AMTo monitor Docker container resource usage, built-in commands, third-party tools, or system-level tools can be used. 1. Real-time monitoring with docker stats: Run docker stats to view CPU, memory, network and disk IO and other indicators, support filtering specific containers and recording them regularly in combination with watch commands. 2. Get container insights through cAdvisor: Deploy cAdvisor containers to obtain detailed performance data and view historical trends and visual information through the Web UI. 3. Combined with system-level tools for in-depth analysis: use Linux tools such as top/htop, iostat, and iftop to monitor resource consumption at the system level, and integrate Prometheus or Grafana to achieve alarms and visualization.
You can monitor Docker container resource usage by using built-in Docker commands, third-party tools, or system-level utilities. The key is to track CPU, memory, disk I/O, and network activity effectively without adding too much overhead.
1. Use docker stats for Real-Time Monitoring
Docker provides a built-in command called docker stats that shows live performance data for running containers.
- It displays metrics like CPU usage, memory consumption, network I/O, and block I/O.
- Just run
docker statsin your terminal and you'll get an ongoing view of all containers. - You can filter it for specific containers using their names or IDs:
docker stats <container_name_or_id></container_name_or_id>
If you want to log this data periodically, you can combine it with tools like watch or write a simple script to capture the output at intervals.
This method is quick and doesn't require installing extra software, making it great for basic monitoring needs.
2. Monitor with cAdvisor for Container Insights
Google's cAdvisor (Container Advisor) is a powerful open-source tool that automatically collects, processes, and exports container metrics.
- It works out of the box with Docker and give detailed breakdowns per container.
- You can deploy it as a Docker container itself:
 docker run \
  --volume=/:/rootfs:ro \
  --volume=/var/run:/var/run:ro \
  --volume=/sys:/sys:ro \
  --volume=/var/lib/docker/:/var/lib/docker:ro \
  --publish=8080:8080 \
  --detach=true \
  --name=cadvisor \
  google/cadvisor:latest
- Once running, access its web UI at
http://localhost:8080to see metrics like memory, CPU, network, and filesystem usage over time.
It's especially useful if you're managing multiple containers and want historical data or more visual insights than docker stats offers.
3. Combine Docker with System-Level Tools
For deeper analysis or integration into monitoring systems, you can use traditional Linux tools alongside Docker:
- top / htop : See overall system load and how much resources Docker processes are consuming.
- iostat : Check disk I/O usage related to containers.
- iftop or nload : Monitor network traffic generated by Docker containers.
- ps or pidstat : Track individual process usage inside containers.
These tools don't specifically target containers but give valuable context when troubleshooting performance issues.
Also, if you're working in production environments, consider exporting these metrics to monitoring platforms like Prometheus or Grafana for alerting and visualization.
That's how you can keep an eye on what your Docker containers are doing resource-wise — from quick checks to full-blown monitoring setups. Not overly complex, but easy to overlook some details if you're not familiar with the tools.
The above is the detailed content of How can you monitor the resource usage of a Docker container?. For more information, please follow other related articles on the PHP Chinese website!

Hot AI Tools

Undress AI Tool
Undress images for free

Undresser.AI Undress
AI-powered app for creating realistic nude photos

AI Clothes Remover
Online AI tool for removing clothes from photos.

Clothoff.io
AI clothes remover

Video Face Swap
Swap faces in any video effortlessly with our completely free AI face swap tool!

Hot Article

Hot Tools

Notepad++7.3.1
Easy-to-use and free code editor

SublimeText3 Chinese version
Chinese version, very easy to use

Zend Studio 13.0.1
Powerful PHP integrated development environment

Dreamweaver CS6
Visual web development tools

SublimeText3 Mac version
God-level code editing software (SublimeText3)
 .NET Core Quick Start Tutorial 1. The beginning: Talking about .NET Core
May 07, 2025 pm 04:54 PM
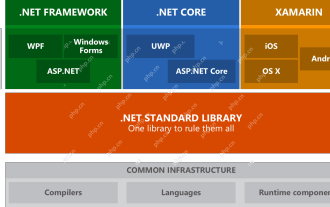
1. The Origin of .NETCore When talking about .NETCore, we must not mention its predecessor .NET. Java was in the limelight at that time, and Microsoft also favored Java. The Java virtual machine on the Windows platform was developed by Microsoft based on JVM standards. It is said to be the best performance Java virtual machine at that time. However, Microsoft has its own little abacus, trying to bundle Java with the Windows platform and add some Windows-specific features. Sun's dissatisfaction with this led to a breakdown of the relationship between the two parties, and Microsoft then launched .NET. .NET has borrowed many features of Java since its inception and gradually surpassed Java in language features and form development. Java in version 1.6
 How to develop a complete Python Web application?
May 23, 2025 pm 10:39 PM
To develop a complete Python Web application, follow these steps: 1. Choose the appropriate framework, such as Django or Flask. 2. Integrate databases and use ORMs such as SQLAlchemy. 3. Design the front-end and use Vue or React. 4. Perform the test, use pytest or unittest. 5. Deploy applications, use Docker and platforms such as Heroku or AWS. Through these steps, powerful and efficient web applications can be built.
 Docker vs. Kubernetes: Key Differences and Synergies
May 01, 2025 am 12:09 AM
Docker and Kubernetes are leaders in containerization and orchestration. Docker focuses on container lifecycle management and is suitable for small projects; Kubernetes is good at container orchestration and is suitable for large-scale production environments. The combination of the two can improve development and deployment efficiency.
 How to view process information inside Docker container
May 19, 2025 pm 09:06 PM
There are three ways to view the process information inside the Docker container: 1. Use the dockertop command to list all processes in the container and display PID, user, command and other information; 2. Use dockerexec to enter the container, and then use the ps or top command to view detailed process information; 3. Use the dockerstats command to display the usage of container resources in real time, and combine dockertop to fully understand the performance of the container.
 How to deploy a PyTorch app on Ubuntu
May 29, 2025 pm 11:18 PM
Deploying a PyTorch application on Ubuntu can be done by following the steps: 1. Install Python and pip First, make sure that Python and pip are already installed on your system. You can install them using the following command: sudoaptupdatesudoaptinstallpython3python3-pip2. Create a virtual environment (optional) To isolate your project environment, it is recommended to create a virtual environment: python3-mvenvmyenvsourcemyenv/bin/activatet
 Performance Tuning of Jenkins Deployment on Debian
May 28, 2025 pm 04:51 PM
Deploying and tuning Jenkins on Debian is a process involving multiple steps, including installation, configuration, plug-in management, and performance optimization. Here is a detailed guide to help you achieve efficient Jenkins deployment. Installing Jenkins First, make sure your system has a Java environment installed. Jenkins requires a Java runtime environment (JRE) to run properly. sudoaptupdatesudoaptininstallopenjdk-11-jdk Verify that Java installation is successful: java-version Next, add J
 Efficient operation method for batch stopping Docker containers
May 19, 2025 pm 09:03 PM
An efficient way to batch stop a Docker container includes using basic commands and tools. 1. Use the dockerstop$(dockerps-q) command and adjust the timeout time, such as dockerstop-t30$(dockerps-q). 2. Use dockerps filtering options, such as dockerstop$(dockerps-q--filter"label=app=web"). 3. Use the DockerCompose command docker-composedown. 4. Write scripts to stop containers in order, such as stopping db, app and web containers.
 How to compare the differences in different Docker image versions
May 19, 2025 pm 09:00 PM
There are two ways to compare the differences in different Docker image versions: 1. Use the dockerdiff command to view changes in the container file system; 2. Use the dockerhistory command to view the hierarchy difference in the image building. These methods help to understand and optimize image versioning.


