

Monitor Redis Droplet with Redis Exporter Service
Apr 10, 2025 pm 01:36 PM
Effective monitoring of Redis databases is critical to maintaining optimal performance, identifying potential bottlenecks, and ensuring overall system reliability. Redis Exporter Service is a powerful utility designed to monitor Redis databases using Prometheus. This tutorial will guide you through the complete setup and configuration of Redis Exporter Service, ensuring you seamlessly build monitoring solutions. By studying this tutorial, you will achieve fully operational monitoring settings

Method 1: Manual configuration
We continue with the manual configuration method in this section.
Create Prometheus system users and groups
Create a system user and group "prometheus" named to manage the exporter
sudo groupadd --system prometheus
sudo useradd -s /sbin/nologin --system -g prometheus prometheus
Download and install Redis Exporter
Download the latest version of Redis Exporter downloaded files from GitHub and move the binary to the /usr/local/bin/ directory.
curl -s https://api.github.com/repos/oliver006/redis_exporter/releases/latest | grep browser_download_url | grep linux-amd64 | cut -d '"' -f 4 | wget -qi -
tar xvf redis_exporter-*.linux-amd64.tar.gz
sudo mv redis_exporter-*.linux-amd64/redis_exporter /usr/local/bin/
Verify Redis exporter installation
redis_exporter --version
Here is the sample output:

Configure systemd service for Redis Exporter
Create a systemd service unit file to manage Redis Exporter
sudo vim /etc/systemd/system/redis_exporter.service
Add the following to the file:
 [Unit]Description=Prometheus Redis ExporterDocumentation=https://github.com/oliver006/redis_exporterWants=network-online.targetAfter=network-online.target[Service]Type=simpleUser=prometheusGroup=prometheusExecReload=/bin/kill -HUP $MAINPIDExecStart=/usr/local/bin/redis_exporter
   --log-format=txt
   --namespace=redis
   --web.listen-address=:9121
   --web.telemetry-path=/metricsSyslogIdentifier=redis_exporterRestart=always[Install]WantedBy=multi-user.target
Reload systemd and start Redis Exporter service
sudo systemctl daemon-reload
sudo systemctl enable redis_exporter
sudo systemctl start redis_exporter
Configuring Prometheus Droplet (manual method)
Let's configure the Prometheous Droplet manually.
Backup the prometheus.yml file
cp /etc/prometheus/prometheus.yml /etc/prometheus/prometheus.yml-$(date '%d%b%Y-%H:%M')
Add Redis Exporter endpoint scraped
Log in to your Prometheus server and add the Redis Exporter endpoint to crawl.
Replace the IP address and port with your Redis Exporter endpoint (9121 is the default port for Redis Exporter service).
vi /etc/prometheus/prometheus.yml
 scrape_configs:
  - job_name: server1_db
    static_configs:
      - targets: ['10.10.1.10:9121']
        labels:
          alias: db1

  - job_name: server2_db
    static_configs:
      - targets: ['10.10.1.11:9121']
        labels:
Manual configuration ends here. Now, let's continue with script-based configuration.
Method 2: Use scripts to configure
You can also do this by running two scripts - one for the target Droplet and the other for the Prometheus Droplet.
Let's start by configuring the target Droplet.
Connect to the target Droplet via SSH.
Use the following command to download the target configuration script:
wget https://solutions-files.ams3.digitalocianspaces.com/Redis-Monitoring/DO_Redis_Target_Config.sh
After downloading the script, make sure it has executable permissions to run:
chmod x DO_Redis_Target_Config.sh
Execute the script by running the following command:
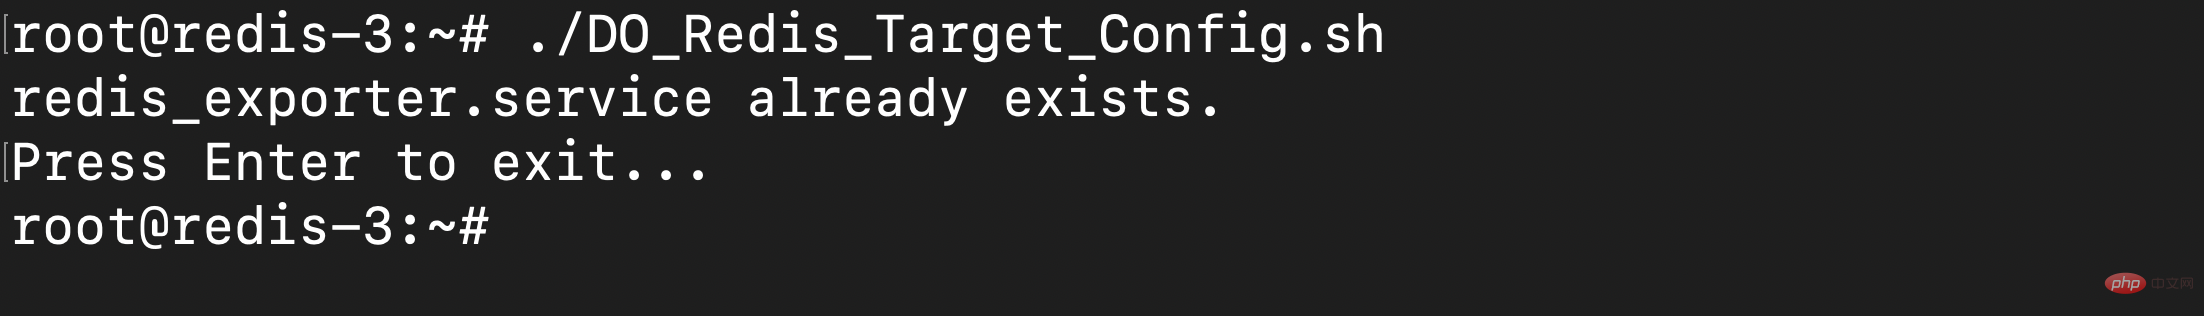
./DO_Redis_Target_Config.sh
Configuration
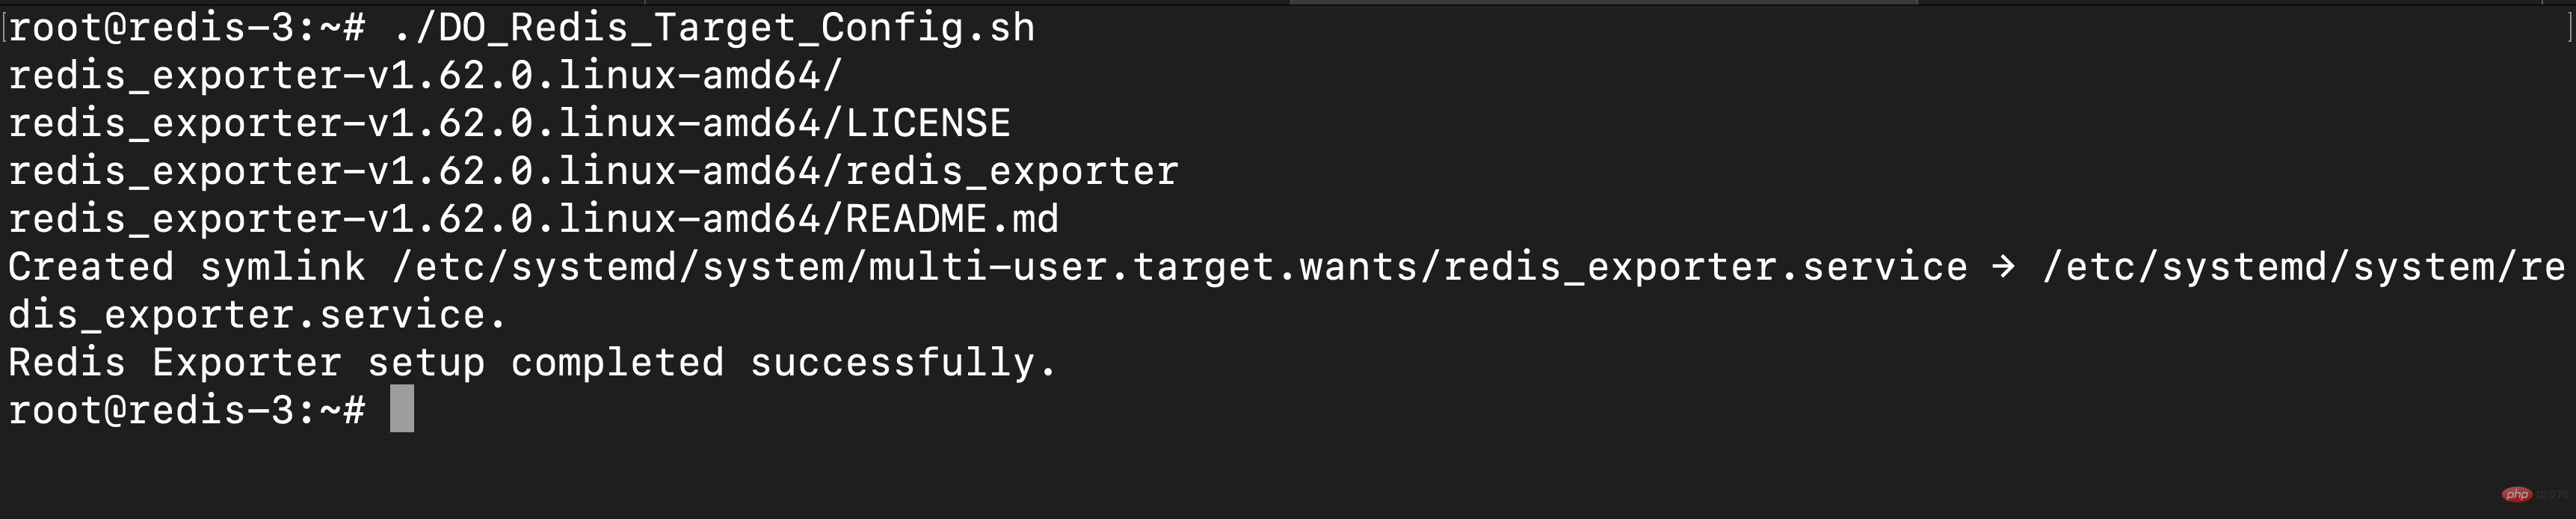
Note: If the redis_exporter.service file already exists, the script will not run.
Configure Prometheus Droplet (Script Method)
SSH to Prometheus Droplet and download the script using the following command:
wget https://solutions-files.ams3.digitalocianspaces.com/Redis-Monitoring/DO_Redis_Prometheus_Config.sh
After downloading the script, make sure it has executable permissions to run:
chmod x DO_Redis_Prometheus_Config.sh
Execute script running:
./DO_Redis_Prometheus_Config.sh
Enter the number of droplets to add to the monitoring.
Enter the host name and IP address.
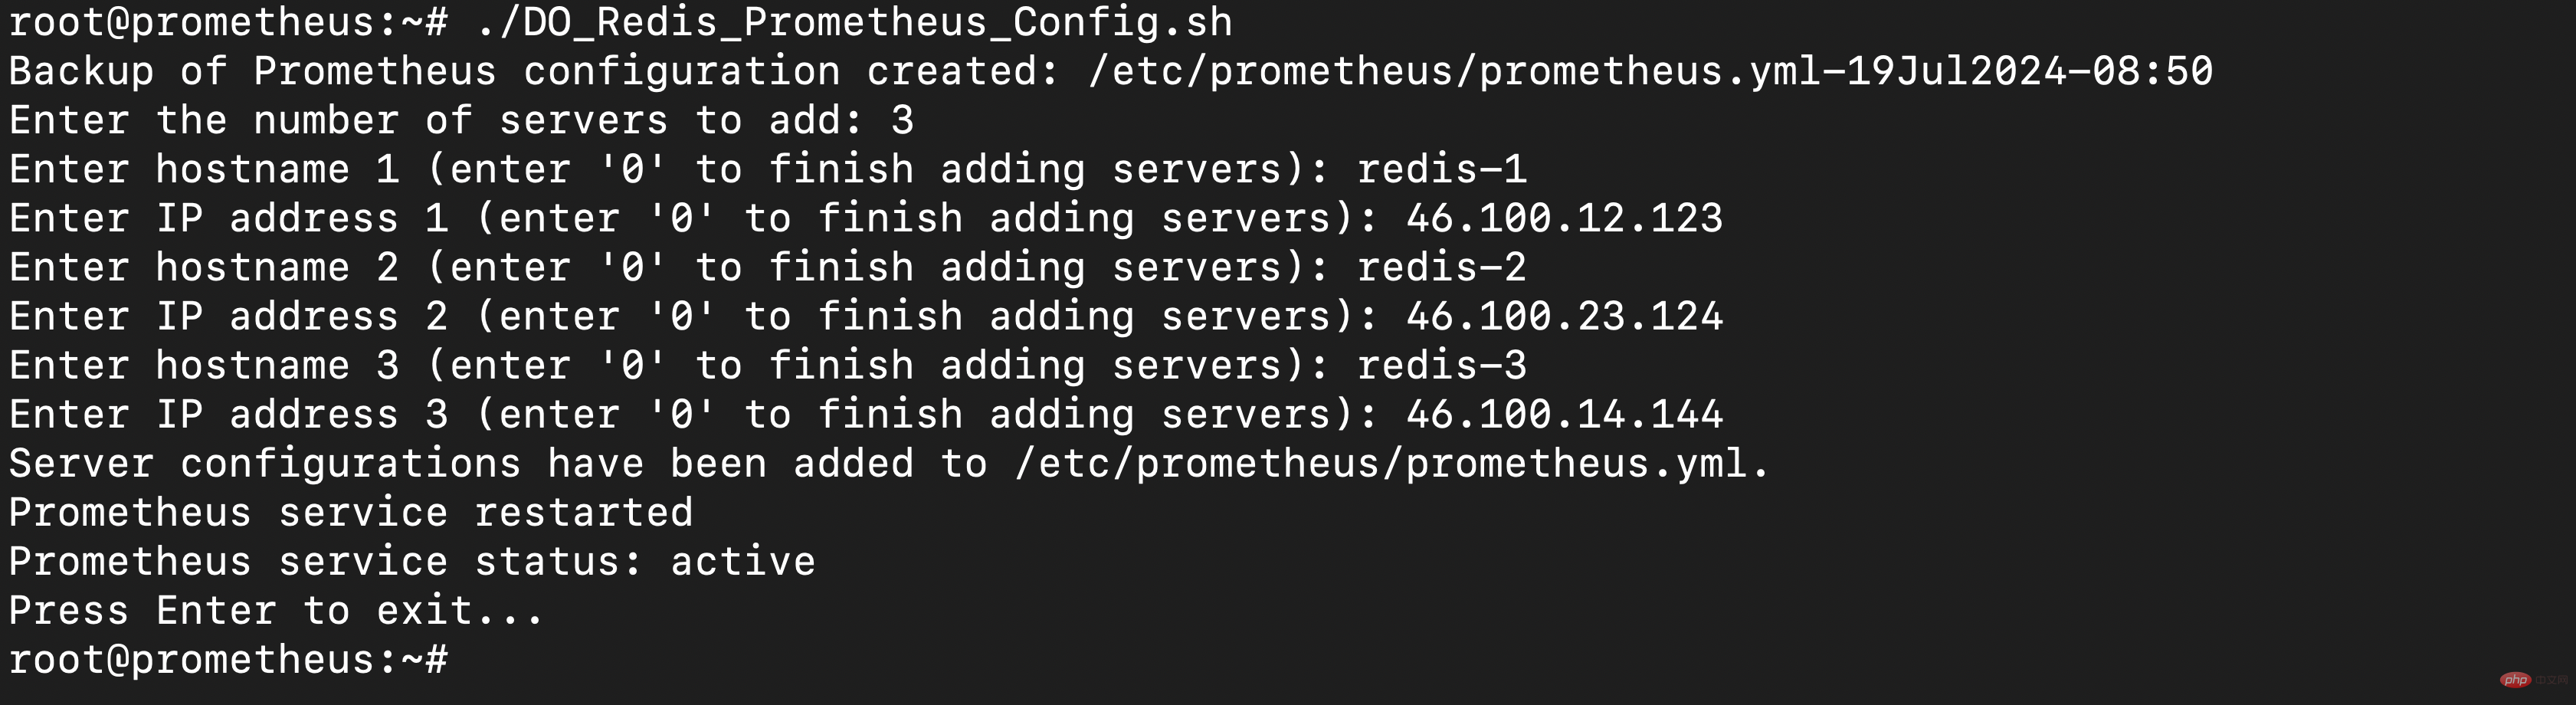
Configuration is complete.
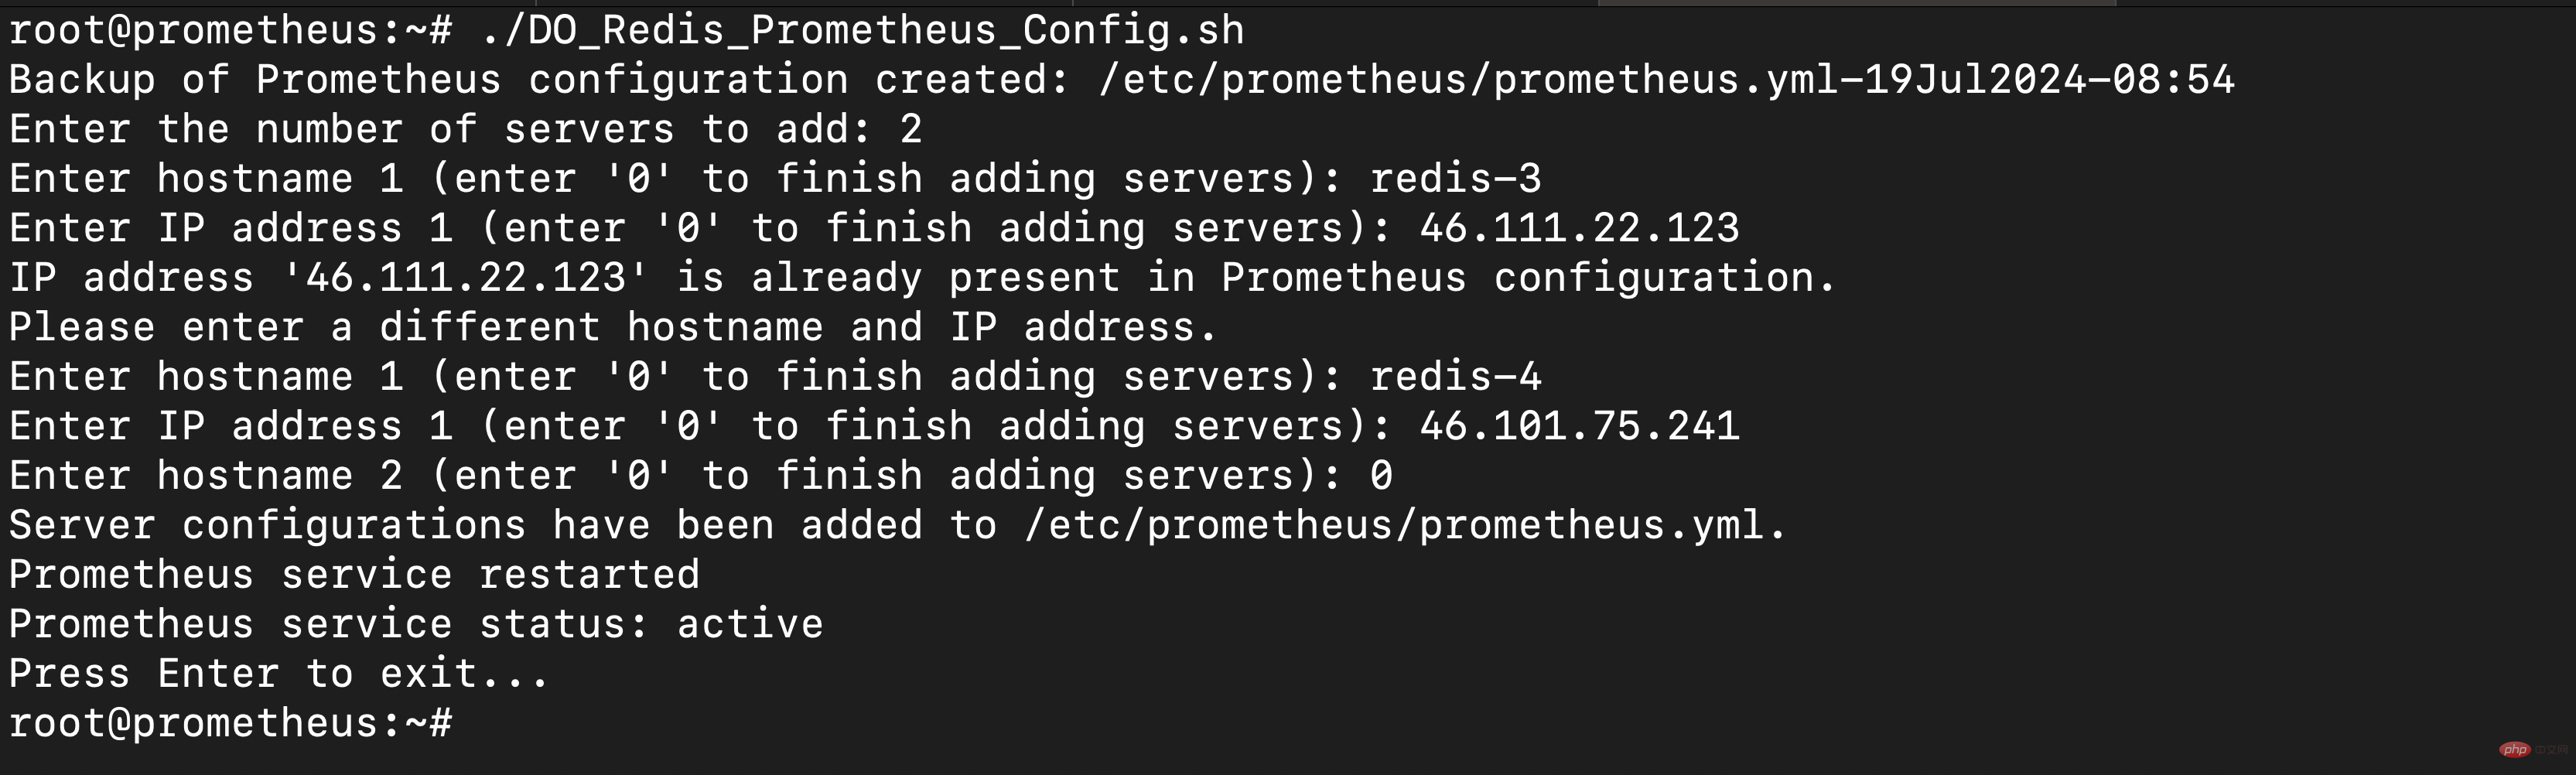
After adding, check whether the target is updated by accessing the URL prometheushostname:9090/targets.
Note: If the IP address you entered has been added to the monitoring, you will be asked to enter the details again. Also, if you don't have more servers to add, you can enter 0 to exit script
Configure Grafana
Access Grafana-IP:3000 through your browser to log in to the Grafana dashboard.
Go to Configuration > Data Source.
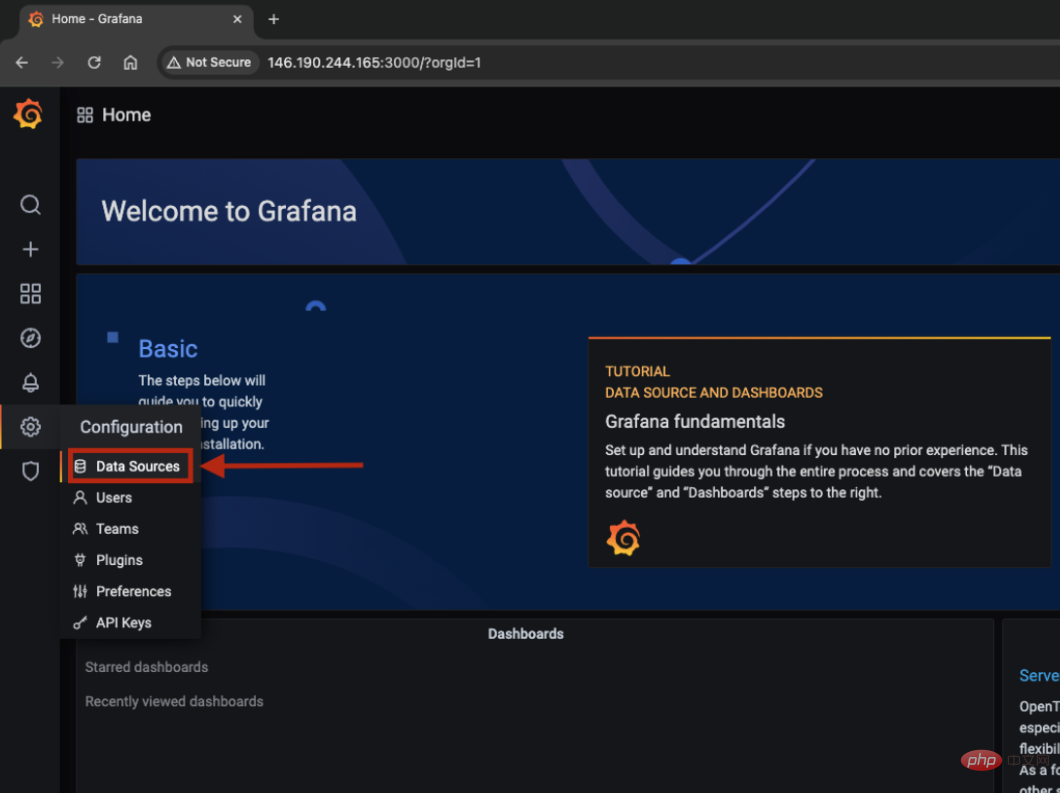
Click Add Data Source.
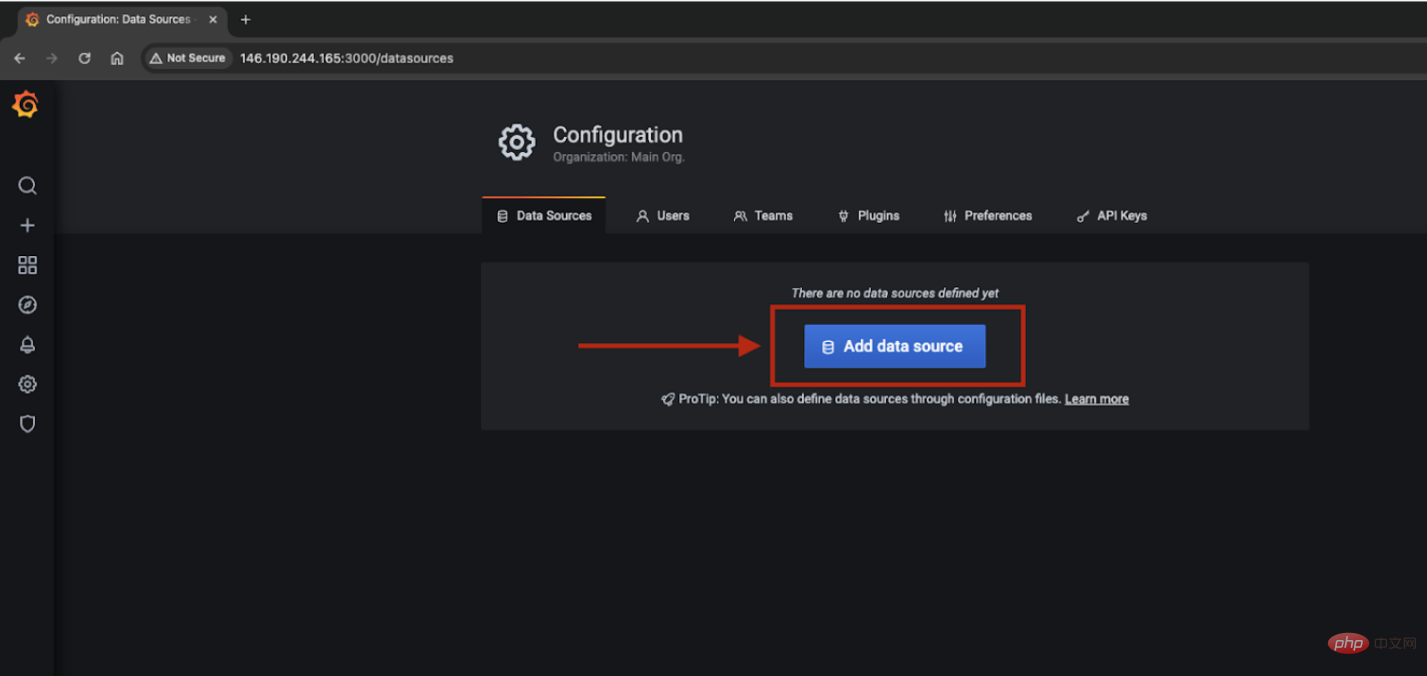
Search and select Prometheus.
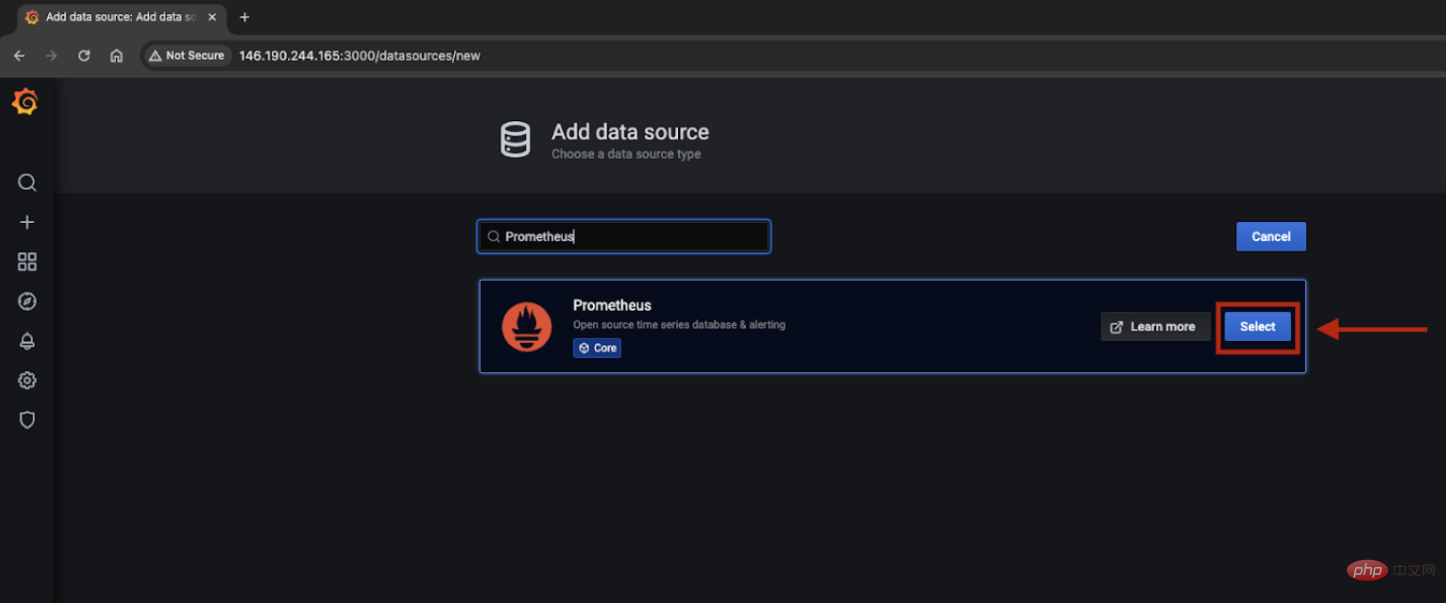
Enter the name Prometheus and URL (Prometheus hostname: 9090) and click Save and Test. If you see "Data Source is running", you have successfully added the data source. When finished, go to Create > Import.
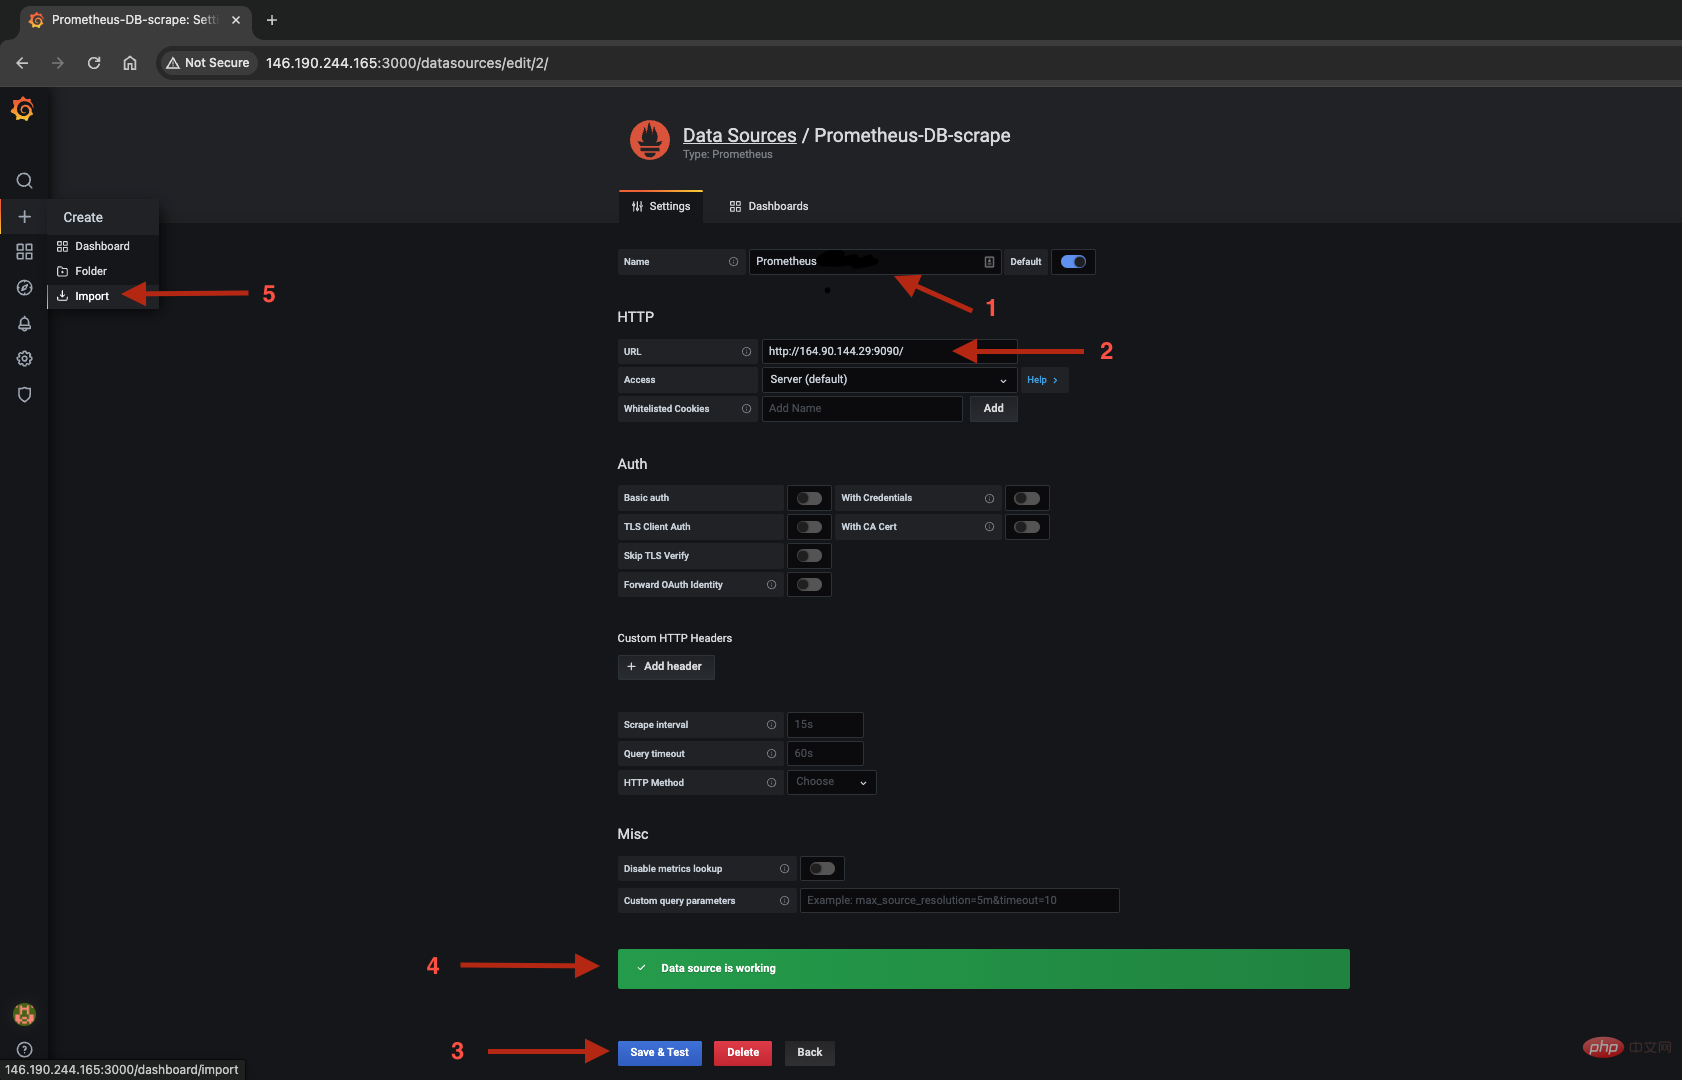
You can configure the dashboard manually or import the dashboard to upload the JSON file by importing it through the following methods. The JSON template for Redis monitoring can be found in the following link:
https://solutions-files.ams3.digitalocianspaces.com/Redis-Monitoring/DO_Grafana-Redis_Monitoring.json
Fill in the fields and import them.
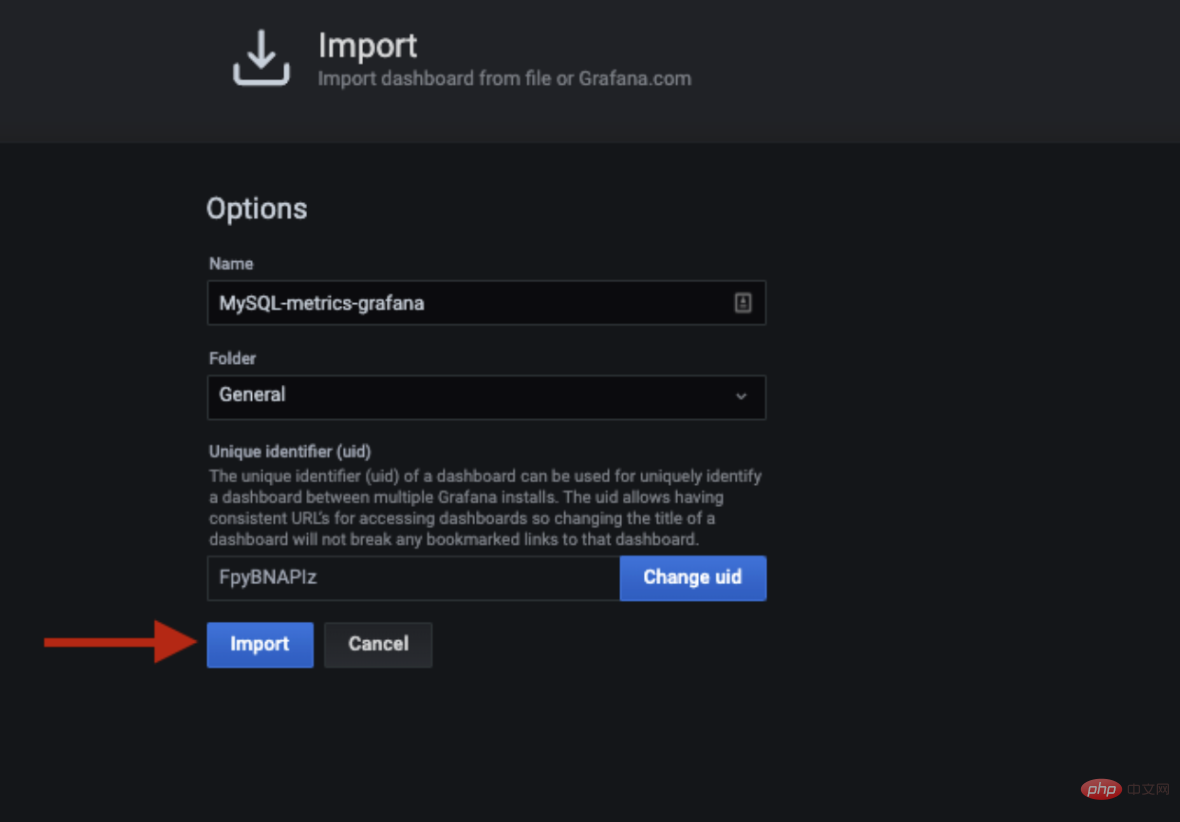
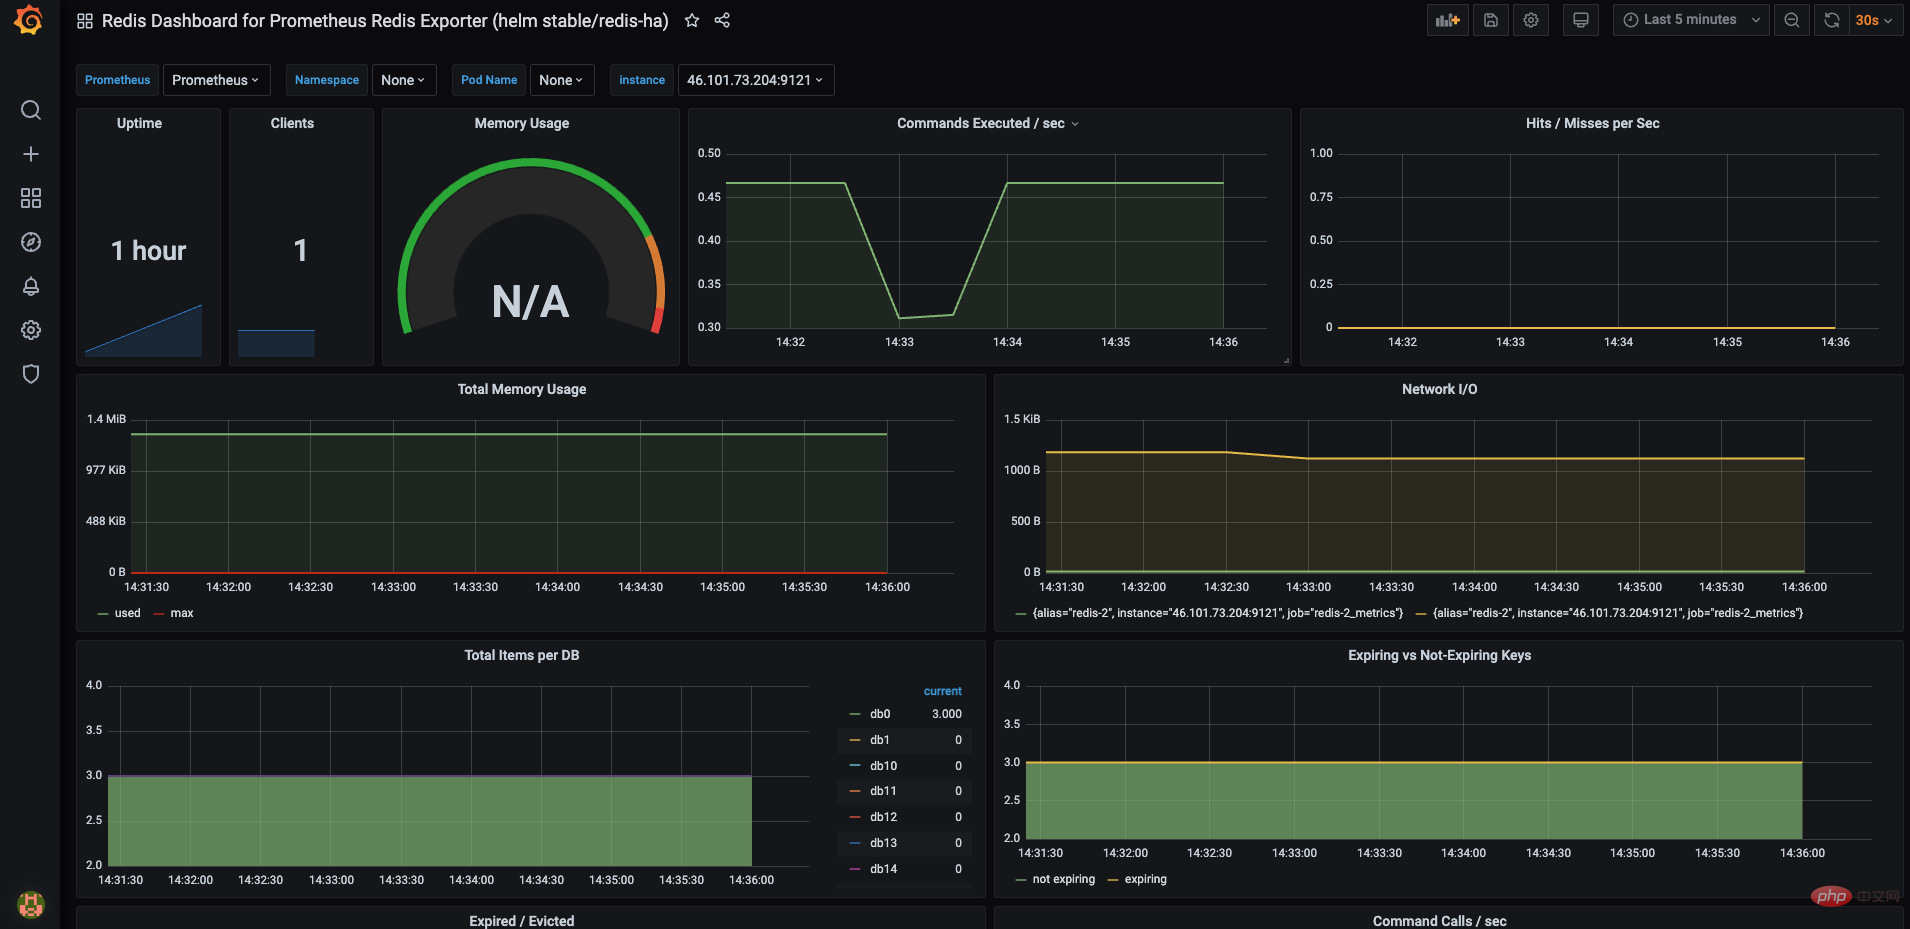
The Grafana dashboard is ready. Select the host and check if the metric is visible. Feel free to modify and edit the dashboard as needed.
The above is the detailed content of Monitor Redis Droplet with Redis Exporter Service. For more information, please follow other related articles on the PHP Chinese website!

Hot AI Tools

Undress AI Tool
Undress images for free

Undresser.AI Undress
AI-powered app for creating realistic nude photos

AI Clothes Remover
Online AI tool for removing clothes from photos.

Clothoff.io
AI clothes remover

Video Face Swap
Swap faces in any video effortlessly with our completely free AI face swap tool!

Hot Article
Hot Tools

Notepad++7.3.1
Easy-to-use and free code editor

SublimeText3 Chinese version
Chinese version, very easy to use

Zend Studio 13.0.1
Powerful PHP integrated development environment

Dreamweaver CS6
Visual web development tools

SublimeText3 Mac version
God-level code editing software (SublimeText3)


 What is Ethereum? What are the ways to obtain Ethereum ETH?
Jul 31, 2025 pm 11:00 PM
What is Ethereum? What are the ways to obtain Ethereum ETH?
Jul 31, 2025 pm 11:00 PM
Ethereum is a decentralized application platform based on smart contracts, and its native token ETH can be obtained in a variety of ways. 1. Register an account through centralized platforms such as Binance and Ouyiok, complete KYC certification and purchase ETH with stablecoins; 2. Connect to digital storage through decentralized platforms, and directly exchange ETH with stablecoins or other tokens; 3. Participate in network pledge, and you can choose independent pledge (requires 32 ETH), liquid pledge services or one-click pledge on the centralized platform to obtain rewards; 4. Earn ETH by providing services to Web3 projects, completing tasks or obtaining airdrops. It is recommended that beginners start from mainstream centralized platforms, gradually transition to decentralized methods, and always attach importance to asset security and independent research, to
 How to Schedule Tasks on Linux with Cron and anacron
Aug 01, 2025 am 06:11 AM
How to Schedule Tasks on Linux with Cron and anacron
Aug 01, 2025 am 06:11 AM
cronisusedforpreciseschedulingonalways-onsystems,whileanacronensuresperiodictasksrunonsystemsthataren'tcontinuouslypowered,suchaslaptops;1.Usecronforexacttiming(e.g.,3AMdaily)viacrontab-ewithsyntaxMINHOURDOMMONDOWCOMMAND;2.Useanacronfordaily,weekly,o
 How to use the CSS backdrop-filter property?
Aug 02, 2025 pm 12:11 PM
How to use the CSS backdrop-filter property?
Aug 02, 2025 pm 12:11 PM
Backdrop-filter is used to apply visual effects to the content behind the elements. 1. Use backdrop-filter:blur(10px) and other syntax to achieve the frosted glass effect; 2. Supports multiple filter functions such as blur, brightness, contrast, etc. and can be superimposed; 3. It is often used in glass card design, and it is necessary to ensure that the elements overlap with the background; 4. Modern browsers have good support, and @supports can be used to provide downgrade solutions; 5. Avoid excessive blur values and frequent redrawing to optimize performance. This attribute only takes effect when there is content behind the elements.
 What are the mainstream coin playing software in the currency circle?
Jul 31, 2025 pm 08:09 PM
What are the mainstream coin playing software in the currency circle?
Jul 31, 2025 pm 08:09 PM
The choice of mainstream coin-playing software in 2025 requires priority to security, rates, currency coverage and innovation functions. 1. Global comprehensive platforms such as Binance (19 billion US dollars in daily average, 1,600 currencies), Ouyi (125x leverage, Web3 integration), Coinbase (compliance benchmark, learning to earn coins) are suitable for most users; 2. High-potential featured platforms such as Gate.io (extremely fast coins, trading is 3.0), Kucoin (GameFi, 35% pledge income), BYDFi (Meme currency, MPC security) meet the segmentation needs; 3. Professional platforms Kraken (MiCA certification, zero accident), Bitfinex (5ms delay, 125x leverage) service institutions and quantitative teams; suggest
 How to create a bouncing animation with CSS?
Aug 02, 2025 am 05:44 AM
How to create a bouncing animation with CSS?
Aug 02, 2025 am 05:44 AM
Define@keyframesbouncewith0%,100%attranslateY(0)and50%attranslateY(-20px)tocreateabasicbounce.2.Applytheanimationtoanelementusinganimation:bounce0.6sease-in-outinfiniteforsmooth,continuousmotion.3.Forrealism,use@keyframesrealistic-bouncewithscale(1.1
 Getting started with newcomers in the currency circle: Capture hot coins to screen potential coins
Jul 31, 2025 pm 09:48 PM
Getting started with newcomers in the currency circle: Capture hot coins to screen potential coins
Jul 31, 2025 pm 09:48 PM
Identifying and exploring potential assets in the crypto field requires a four-step method: 1. Capture market signals such as social media topic growth rate, growth of ecological interaction address number, and mainstream platform search index; 2. Verify fundamentals such as team background, rationality of token model, and distribution of on-chain coin address; 3. Combined with technical indicators such as weekly breakthroughs in key resistance levels, trading volume exceeds 3 times per month, and RSI is in the 40-60 range; 4. Establish a continuous tracking mechanism for data dashboard monitoring, project milestone reminders and development progress review, and beware of traps such as abnormal promotion, liquidity pool imbalance and lack of technical documents, and optimize decision-making through small-scale testing, establishing tracking lists and retaining 20% cash reserves, and ultimately relying on in-depth research rather than chasing hot spots to achieve long-term success.
 How to Amend the Previous Git Commit Message
Aug 01, 2025 am 03:34 AM
How to Amend the Previous Git Commit Message
Aug 01, 2025 am 03:34 AM
Toamendthemostrecentcommitmessage,usegitcommit--amend-m"Yournewcommitmessage"ifthecommithasn’tbeenpushed;thisrewritesthelocalcommithistorywiththenewmessage.2.Toeditthemessageinyourdefaulteditor,rungitcommit--amendwithoutthe-mflag,allowingyo
 How to create a text gradient with CSS?
Aug 01, 2025 am 07:39 AM
How to create a text gradient with CSS?
Aug 01, 2025 am 07:39 AM
Use background-image and background-clip:text to achieve CSS text gradient effect; 2. You must set -webkit-background-clip:text and -webkit-text-fill-color:transparent to ensure browser compatibility; 3. You can customize linear or radial gradients, and it is recommended to use bold or large text to improve visual effect; 4. It is recommended to set color as an alternative color for unsupported environments; 5. Alternatives can use -webkit-mask-image to achieve more complex effects, but they are mainly suitable for advanced scenarios; this method is simple, has good compatibility and visual
