

Fixing 'Timed out waiting for the debugger to attach' in VSCode
Jul 08, 2025 am 01:26 AM
When the "Timed out waiting for the debugger to attach" issue occurs, it is usually because the connection is not established correctly in the debugging process. 1. Check whether the launch.json configuration is correct, ensure that the request type is launch or attach and there is no spelling error; 2. Confirm whether the debugger is waiting for the debugger to connect, and add debugpy.wait_for_attach() and other mechanisms; 3. Check whether the port is occupied or firewall restricted, and replace the port or close the occupied process if necessary; 4. Confirm that the port mapping and access rights are configured correctly in a remote or container environment; 5. Update VSCode, plug-in and debug library versions to solve potential compatibility issues. Follow the above steps to check one by one to locate and resolve the connection timeout problem.

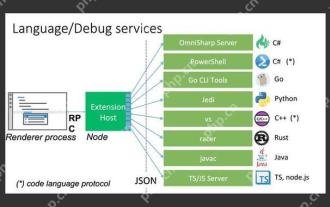
When the problem of "Timed out waiting for the debugger to attach" occurs, it is usually when debugging certain languages ??(such as Python, Node.js, etc.). VSCode itself is just an editor, and the real debugging process is done by attaching it to a running debugger. If this connection timed out, this error will be reported.
The core of solving this problem is to figure out which link in the debugging process is stuck. Below are several common reasons and corresponding treatment methods.

Check your launch.json configuration
This is one of the most common sources of problems. The launch.json file controls how VSCode starts or attaches a debugger.
If you are using a modular debugging method similar to Python, make sure that the configuration file has the correct request type:
 {
  "type": "python",
  "request": "launch",
  "name": "Python: Current File",
  "program": "${file}",
  "console": "integratedTerminal",
  "stopOnEntry": false
}- The request should be
launchorattach, depending on your usage scenario. - If you are using remote debugging or need to attach manually, remember to change it
attachand set the host and port. - Make sure there are no spelling errors, such as
"type"written as"types", such minor errors can easily lead to inability to connect.
Is the debugger really waiting for the debugger?
Sometimes, the program runs too fast and it ends before the debugger is connected. At this time, the prompt "timed out".
Taking Python as an example, if you are using ptvsd or debugpy , you can add a waiting mechanism:
 import debugpy
debugpy.listen(("0.0.0.0", 5678))
print("Waiting for the debugger to connect...")
debugpy.wait_for_attach()
This allows the program to stop and wait for the debugger to connect before it actually starts executing. If this step is not available, the program may have been completed before VSCode can react.
Check port occupation or firewall settings
Sometimes, although the debugger is started, VSCode cannot connect to it at all because the port is occupied or the firewall is restricted.
You can manually check if the port is occupied:
 lsof -i:5678
# or on Windows:
netstat -ano | findstr :5678
If you find that the port is occupied, you can choose to kill the process or try another port.
In addition, in remote development or container environment, you should also pay attention to:
- Is the correct port mapped
- Whether to allow external access to this port
- Is the SSH tunnel correctly configured?
Update plug-in and debugger versions
Many of VSCode's debugging functions rely on plug-ins, such as extensions such as Python plug-ins and Debugger for Chrome. If you are using an older version of the plugin, there may be compatibility issues.
The following things are recommended:
- Update VSCode to the latest version
- Update plugins for related languages
- Update debugger library (such as
debugpy,node-inspect)
For example, upgrade debugpy :
pip install --upgrade debugpy
Sometimes, the official update fixes the connection logic problem, and directly upgrades can solve the problem.
Basically, these common investigation directions. The problem seems complicated, but in most cases it is because of the configuration mismatch, the connection is not working, or the program runs too fast. Follow the above method to check step by step and it should be done.
The above is the detailed content of Fixing 'Timed out waiting for the debugger to attach' in VSCode. For more information, please follow other related articles on the PHP Chinese website!

Hot AI Tools

Undress AI Tool
Undress images for free

Undresser.AI Undress
AI-powered app for creating realistic nude photos

AI Clothes Remover
Online AI tool for removing clothes from photos.

Clothoff.io
AI clothes remover

Video Face Swap
Swap faces in any video effortlessly with our completely free AI face swap tool!

Hot Article
Hot Tools

Notepad++7.3.1
Easy-to-use and free code editor

SublimeText3 Chinese version
Chinese version, very easy to use

Zend Studio 13.0.1
Powerful PHP integrated development environment

Dreamweaver CS6
Visual web development tools

SublimeText3 Mac version
God-level code editing software (SublimeText3)
Hot Topics


 Laravel environment construction and basic configuration (Windows/Mac/Linux)
Apr 30, 2025 pm 02:27 PM
Laravel environment construction and basic configuration (Windows/Mac/Linux)
Apr 30, 2025 pm 02:27 PM
The steps to build a Laravel environment on different operating systems are as follows: 1.Windows: Use XAMPP to install PHP and Composer, configure environment variables, and install Laravel. 2.Mac: Use Homebrew to install PHP and Composer and install Laravel. 3.Linux: Use Ubuntu to update the system, install PHP and Composer, and install Laravel. The specific commands and paths of each system are different, but the core steps are consistent to ensure the smooth construction of the Laravel development environment.
 Use VSCode to perform version fallback operation of code
May 15, 2025 pm 09:42 PM
Use VSCode to perform version fallback operation of code
May 15, 2025 pm 09:42 PM
In VSCode, you can use Git for code version fallback. 1. Use gitreset--hardHEAD~1 to fall back to the previous version. 2. Use gitreset--hard to fall back to a specific commit. 3. Use gitrevert to safely fall back without changing history.
 Environment configuration for running Ruby code in VSCode
May 15, 2025 pm 09:30 PM
Environment configuration for running Ruby code in VSCode
May 15, 2025 pm 09:30 PM
Configuring the Ruby development environment in VSCode requires the following steps: 1. Install Ruby: Download and install from the official website or using RubyInstaller. 2. Install the plug-in: Install CodeRunner and Ruby plug-ins in VSCode. 3. Set up the debugging environment: Install the DebuggerforRuby plug-in and create a launch.json file in the .vscode folder for configuration. This way, you can write, run, and debug Ruby code efficiently in VSCode.
 How to manually install plugin packages in VSCode
May 15, 2025 pm 09:33 PM
How to manually install plugin packages in VSCode
May 15, 2025 pm 09:33 PM
The steps to manually install the plug-in package in VSCode are: 1. Download the .vsix file of the plug-in; 2. Open VSCode and press Ctrl Shift P (Windows/Linux) or Cmd Shift P (Mac) to call up the command panel; 3. Enter and select Extensions:InstallfromVSIX..., then select .vsix file and install. Manually installing plug-ins provides a flexible way to install, especially when the network is restricted or the plug-in market is unavailable, but attention needs to be paid to file security and possible dependencies.
 Configure VSCode and GitHub for code synchronization
May 20, 2025 pm 06:33 PM
Configure VSCode and GitHub for code synchronization
May 20, 2025 pm 06:33 PM
Configuring VSCode to synchronize code with GitHub can improve development efficiency and team collaboration. First, install the "GitHubPullRequestsandIssues" and "GitLens" plugins; second, configure the GitHub account; then clone or create a repository; finally, submit and push the code to GitHub.
 Best Practices for Writing JavaScript Code with VSCode
May 15, 2025 pm 09:45 PM
Best Practices for Writing JavaScript Code with VSCode
May 15, 2025 pm 09:45 PM
Best practices for writing JavaScript code in VSCode include: 1) Install Prettier, ESLint, and JavaScript (ES6) codesnippets extensions, 2) Configure launch.json files for debugging, and 3) Use modern JavaScript features and optimization loops to improve performance. With these settings and tricks, you can develop JavaScript code more efficiently in VSCode.
 Experience in participating in VSCode offline technology exchange activities
May 29, 2025 pm 10:00 PM
Experience in participating in VSCode offline technology exchange activities
May 29, 2025 pm 10:00 PM
I have a lot of experience in participating in VSCode offline technology exchange activities, and my main gains include sharing of plug-in development, practical demonstrations and communication with other developers. 1. Sharing of plug-in development: I learned how to use VSCode's plug-in API to improve development efficiency, such as automatic formatting and static analysis plug-ins. 2. Practical demonstration: I learned how to use VSCode for remote development and realized its flexibility and scalability. 3. Communicate with developers: I have obtained skills to optimize VSCode startup speed, such as reducing the number of plug-ins loaded at startup and managing the plug-in loading order. In short, this event has benefited me a lot and I highly recommend those who are interested in VSCode to participate.
 Solve the coding settings and garbled problems of VSCode when dealing with multilingual projects
May 22, 2025 pm 10:57 PM
Solve the coding settings and garbled problems of VSCode when dealing with multilingual projects
May 22, 2025 pm 10:57 PM
VSCode solves the problems of multilingual project coding and garbled code including: 1. Ensure that the file is saved with correct encoding and use the "redetection encoding" function; 2. Set the file encoding to UTF-8 and automatically detect the encoding; 3. Control whether to add BOM; 4. Use the "EncodingConverter" plug-in to convert encoding; 5. Use the multiple workspace functions to set encoding for different sub-projects; 6. Optimize performance and ignore unnecessary file monitoring. Through these steps, the coding problem of multilingual projects can be effectively dealt with.
