


Violin Plots: A Powerful Data Visualization Tool
This article delves into violin plots, a compelling data visualization technique merging box plots and density plots. We'll explore how these plots unveil data patterns, making them invaluable for data scientists and machine learning professionals. This guide offers practical techniques and Python examples to empower informed decisions and effective communication of complex datasets.
Key Learning Outcomes:
- Understand the core components and characteristics of violin plots.
- Differentiate violin plots from box plots and density plots.
- Explore the applications of violin plots in machine learning and data analysis.
- Gain hands-on experience creating and comparing these plots using Python code.
- Recognize the importance of violin plots in exploratory data analysis (EDA) and model assessment.
Table of Contents:
- Introduction
- Understanding Violin Plots
- Applications in Data Analysis and Machine Learning
- Comparing Violin, Box, and Density Plots
- Conclusion
- Frequently Asked Questions
Deciphering Violin Plots:
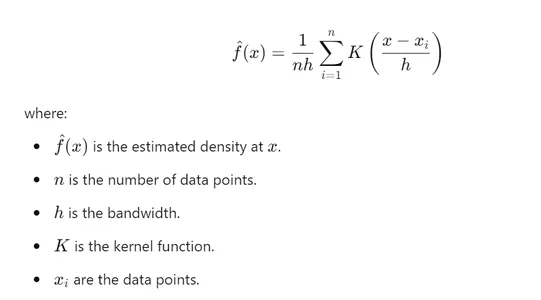
Violin plots offer a sophisticated way to visualize data by combining box plots and density plots. The foundation lies in kernel density estimation (KDE), a non-parametric method for estimating the probability density function (PDF) of a random variable. KDE smooths data points, providing a continuous representation of the data distribution.
Key KDE concepts include:
- Kernel Function: A function that smooths data points by assigning weights based on distance from a target point. Gaussian kernels are common, but others (linear, Epanechnikov) exist.
- Bandwidth: Controls the smoothness of the KDE. A large bandwidth over-smooths, while a small bandwidth overfits.
- Estimation: KDE involves placing a kernel on each data point and summing them for the overall density estimate. The mathematical representation is shown below:
A violin plot mirrors the KDE on both sides of a central box plot, creating the violin shape. The key components are:
- Central Box Plot: Shows the median and interquartile range (IQR).
- Density Plot: Illustrates data probability density, highlighting high-concentration areas.
- Axes: The x-axis represents categories/groups, and the y-axis shows the data distribution.
Violin plots excel with complex distributions, revealing multi-modality and outliers. However, their complexity might reduce intuitiveness for those unfamiliar with data visualization.
Applications in Data Science and Machine Learning:
Violin plots find use in various scenarios:
- Feature Analysis: Understanding feature distributions, identifying outliers, and comparing distributions across categories.
- Model Evaluation: Comparing predicted and actual values to detect bias and variance.
- Hyperparameter Tuning: Comparing model performance across different hyperparameter settings.
Comparing Visualization Methods:
Let's compare violin, box, and density plots using Seaborn, a popular Python library.
Step 1: Install Libraries
!pip install seaborn matplotlib pandas numpy
print('Importing Libraries...',end='')
import seaborn as sns
import matplotlib.pyplot as plt
import pandas as pd
import numpy as np
print('Done')
Step 2: Generate Synthetic Data
np.random.seed(11)
data = pd.DataFrame({
    'Category': np.random.choice(['A', 'B', 'C'], size=100),
    'Value': np.random.randn(100)
})
Step 3: Data Summary
print(data.head())
print(data.describe(include='all'))
print(data['Category'].value_counts())
print(data.isnull().sum())
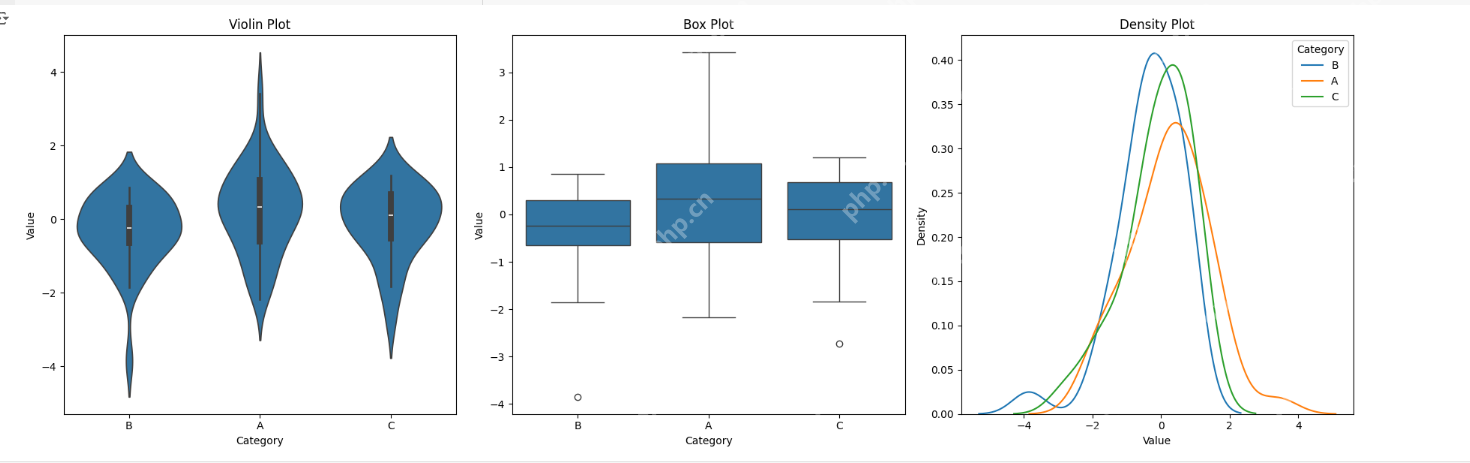
Step 4: Generate Plots
fig, axes = plt.subplots(1, 3, figsize=(18, 6))
sns.violinplot(x='Category', y='Value', data=data, ax=axes[0])
axes[0].set_title('Violin Plot')
sns.boxplot(x='Category', y='Value', data=data, ax=axes[1])
axes[1].set_title('Box Plot')
for category in data['Category'].unique():
    sns.kdeplot(data[data['Category'] == category]['Value'], label=category, ax=axes[2])
axes[2].set_title('Density Plot')
axes[2].legend(title='Category')
plt.tight_layout()
plt.show()
Output:
Conclusion:
Effective data visualization is crucial in machine learning. Violin plots offer a powerful combination of detail and summary statistics, enhancing feature engineering and selection. Their versatility allows analysis of various data types, revealing hidden patterns and anomalies for improved decision-making and communication.
Key Takeaways:
- Violin plots combine density plot detail and box plot summary statistics.
- They are versatile, working with various data types.
- They assist in feature analysis, model evaluation, and hyperparameter optimization.
- Libraries like Seaborn simplify their creation in Python.
- They effectively communicate complex data distributions.
Frequently Asked Questions:
Q1: How do violin plots aid in feature analysis? A1: They reveal data distribution shapes, highlighting trends and outliers, facilitating feature selection by comparing distributions.
Q2: Can they handle large datasets? A2: Yes, but adjust KDE bandwidth to maintain clarity.
Q3: How to interpret multiple peaks? A3: Multiple peaks indicate distinct data clusters or modes, suggesting subgroups.
Q4: How to customize appearance in Python? A4: Seaborn and Matplotlib offer parameters for color, width, and KDE bandwidth.
(Note: The image used in this article is not owned by [Your Name/Organization] and is used with the author's permission.)
The above is the detailed content of Violin Plots: A Tool for Visualizing Data Distributions. For more information, please follow other related articles on the PHP Chinese website!

Hot AI Tools

Undress AI Tool
Undress images for free

Undresser.AI Undress
AI-powered app for creating realistic nude photos

AI Clothes Remover
Online AI tool for removing clothes from photos.

Clothoff.io
AI clothes remover

Video Face Swap
Swap faces in any video effortlessly with our completely free AI face swap tool!

Hot Article
Hot Tools

Notepad++7.3.1
Easy-to-use and free code editor

SublimeText3 Chinese version
Chinese version, very easy to use

Zend Studio 13.0.1
Powerful PHP integrated development environment

Dreamweaver CS6
Visual web development tools

SublimeText3 Mac version
God-level code editing software (SublimeText3)
Hot Topics


 AGI And AI Superintelligence Are Going To Sharply Hit The Human Ceiling Assumption Barrier
Jul 04, 2025 am 11:10 AM
AGI And AI Superintelligence Are Going To Sharply Hit The Human Ceiling Assumption Barrier
Jul 04, 2025 am 11:10 AM
Let’s talk about it. This analysis of an innovative AI breakthrough is part of my ongoing Forbes column coverage on the latest in AI, including identifying and explaining various impactful AI complexities (see the link here). Heading Toward AGI And
 Kimi K2: The Most Powerful Open-Source Agentic Model
Jul 12, 2025 am 09:16 AM
Kimi K2: The Most Powerful Open-Source Agentic Model
Jul 12, 2025 am 09:16 AM
Remember the flood of open-source Chinese models that disrupted the GenAI industry earlier this year? While DeepSeek took most of the headlines, Kimi K1.5 was one of the prominent names in the list. And the model was quite cool.
 Grok 4 vs Claude 4: Which is Better?
Jul 12, 2025 am 09:37 AM
Grok 4 vs Claude 4: Which is Better?
Jul 12, 2025 am 09:37 AM
By mid-2025, the AI “arms race” is heating up, and xAI and Anthropic have both released their flagship models, Grok 4 and Claude 4. These two models are at opposite ends of the design philosophy and deployment platform, yet they
 Premier League Makes An AI Play To Enhance The Fan Experience
Jul 03, 2025 am 11:16 AM
Premier League Makes An AI Play To Enhance The Fan Experience
Jul 03, 2025 am 11:16 AM
On July 1, England’s top football league revealed a five-year collaboration with a major tech company to create something far more advanced than simple highlight reels: a live AI-powered tool that delivers personalized updates and interactions for ev
 In-depth discussion on how artificial intelligence can help and harm all walks of life
Jul 04, 2025 am 11:11 AM
In-depth discussion on how artificial intelligence can help and harm all walks of life
Jul 04, 2025 am 11:11 AM
We will discuss: companies begin delegating job functions for AI, and how AI reshapes industries and jobs, and how businesses and workers work.
 10 Amazing Humanoid Robots Already Walking Among Us Today
Jul 16, 2025 am 11:12 AM
10 Amazing Humanoid Robots Already Walking Among Us Today
Jul 16, 2025 am 11:12 AM
But we probably won’t have to wait even 10 years to see one. In fact, what could be considered the first wave of truly useful, human-like machines is already here. Recent years have seen a number of prototypes and production models stepping out of t
 Context Engineering is the 'New' Prompt Engineering
Jul 12, 2025 am 09:33 AM
Context Engineering is the 'New' Prompt Engineering
Jul 12, 2025 am 09:33 AM
Until the previous year, prompt engineering was regarded a crucial skill for interacting with large language models (LLMs). Recently, however, LLMs have significantly advanced in their reasoning and comprehension abilities. Naturally, our expectation
 Chip Ganassi Racing Announces OpenAI As Mid-Ohio IndyCar Sponsor
Jul 03, 2025 am 11:17 AM
Chip Ganassi Racing Announces OpenAI As Mid-Ohio IndyCar Sponsor
Jul 03, 2025 am 11:17 AM
OpenAI, one of the world’s most prominent artificial intelligence organizations, will serve as the primary partner on the No. 10 Chip Ganassi Racing (CGR) Honda driven by three-time NTT IndyCar Series champion and 2025 Indianapolis 500 winner Alex Pa
