


Introduction
In the world of data analysis, effective communication is key. Pictogram graphs offer a powerful solution, presenting information in a visually appealing and easily digestible format. Unlike complex charts and figures, pictographs—also known as pictogram charts—use images or symbols to represent data, making them accessible to a wider audience. Whether presenting trends to stakeholders or teaching students, pictographs provide a clear and engaging way to convey information.
Learning Outcomes
Upon completion of this guide, you will be able to:
- Define a pictogram graph and differentiate it from other graph types.
- Identify the key elements of an effective pictogram graph.
- Determine appropriate scenarios for using pictogram graphs.
- Apply best practices for designing and interpreting pictogram graphs.
- Create pictogram graphs using various tools.
- Understand the advantages and limitations of pictogram graphs.
- Select the most suitable visualization method for your data.
Table of contents
- What is a Pictogram Graph?
- Essential Elements of an Effective Pictogram Graph
- When to Employ a Pictogram Graph
- Best Practices for Pictogram Graph Design
- Creating a Pictogram Graph
- Advantages and Disadvantages of Pictogram Graphs
- Frequently Asked Questions
What is a Pictogram Graph?
A pictogram graph, or pictograph, is a chart that uses symbols to represent data. Unlike bar or line graphs that rely on numerical values, pictographs use repeated images to visually depict quantities. Each symbol typically represents a specific amount, making the information readily understandable.
Example: Imagine a survey on preferred fruits. A pictogram might use apple icons to represent the number of people who prefer apples, with each icon representing, for instance, 10 people.
Key Elements of an Effective Pictogram Graph
Creating a successful pictogram graph involves more than just choosing icons. Several key elements contribute to its effectiveness:
- Consistent Icons: Maintain uniformity in icon size and style to prevent misinterpretations.
- Clear Labeling: Each icon should have a clear label explaining its value.
- Proportional Icons: Maintain consistent value representation. For example, half an icon should represent half the value of a full icon.
- Balanced Layout: Ensure a clean, balanced design with sufficient spacing for clarity.
When to Use a Pictogram Graph
Pictogram graphs are particularly useful when communicating with audiences who may struggle with complex data or when a more engaging and approachable presentation is desired. Common applications include:
- Educational Settings: Their visual nature makes them ideal for teaching children and young learners.
- Public Presentations: They simplify complex statistics for a general audience.
- Infographics: Their concise visual communication makes them perfect for infographics.
- Marketing Materials: Businesses use them to highlight key data and trends.
Best Practices for Designing a Pictogram Graph
To create an effective pictogram graph:
- Relevant Icons: Choose icons directly related to the data being presented.
- Avoid Clutter: Prevent overcrowding; consider alternative methods for large datasets.
- Strategic Color Use: Colors should enhance readability, not distract.
- Simplicity: Focus on key data points; avoid unnecessary details.
How to Create a Pictogram Graph?
Various tools can be used, from Microsoft Excel to specialized design software like Adobe Illustrator. Here’s a basic Excel approach:
- Data Preparation: Organize data in a clear table.
- Icon Selection: Choose or create suitable icons.
- Icon Insertion: Add icons to cells using Excel's "Insert" function.
- Formatting: Adjust icon size and alignment for consistency.
- Labeling: Clearly label each row or column.
- Review: Ensure accuracy and readability.
Implementation with Code
import matplotlib.pyplot as plt
from pywaffle import Waffle

data = {'Car': 58, 'Pickup': 21, 'Truck': 11, 'Motorcycle': 7}
fig = plt.figure(
    FigureClass=Waffle,
    rows=5,
    values=data,
    colors=["#c1d82f", "#00a4e4", "#fbb034", '#6a737b'],
    legend={'loc': 'upper left', 'bbox_to_anchor': (1, 1)},
    icons=['car-side', 'truck-pickup', 'truck', 'motorcycle'],
    font_size=12,
    icon_legend=True
)
plt.show()
Output:

Advantages and Limitations of Pictogram Graphs
Advantages:
- Ease of Understanding: Intuitive for all audiences.
- Engagement: Visually appealing and memorable.
- Relatability: Uses familiar symbols.
Limitations:
- Limited Detail: Best for simplified data.
- Scaling Challenges: Representing small or large values can be difficult.
- Design Time: Can be time-consuming for complex datasets.
Conclusion
Pictogram graphs provide a user-friendly and visually engaging way to present data. Their simplicity makes them ideal for various applications, but their limitations should be considered when choosing a visualization method. The key is to use them judiciously, ensuring clarity and accuracy in data representation.
Frequently Asked Questions
Q1. What is the primary purpose of a pictogram graph? A1. To present data clearly and engagingly using icons.
Q2. How does a pictogram graph differ from other graph types? A2. It uses images instead of numerical values to represent data.
Q3. When should a pictogram graph be used? A3. When simplifying complex data or engaging a non-expert audience.
Q4. What tools can create pictogram graphs? A4. Microsoft Excel, Adobe Illustrator, Canva, and others.
Q5. What are the limitations of pictogram graphs? A5. They are less suitable for complex or large datasets.
Q6. Are pictogram graphs appropriate for professional reports? A6. Yes, especially when clarity and engagement are paramount.
The above is the detailed content of What is Pictogram Graph? - Analytics Vidhya. For more information, please follow other related articles on the PHP Chinese website!

Hot AI Tools

Undress AI Tool
Undress images for free

Undresser.AI Undress
AI-powered app for creating realistic nude photos

AI Clothes Remover
Online AI tool for removing clothes from photos.

Clothoff.io
AI clothes remover

Video Face Swap
Swap faces in any video effortlessly with our completely free AI face swap tool!

Hot Article
Hot Tools

Notepad++7.3.1
Easy-to-use and free code editor

SublimeText3 Chinese version
Chinese version, very easy to use

Zend Studio 13.0.1
Powerful PHP integrated development environment

Dreamweaver CS6
Visual web development tools

SublimeText3 Mac version
God-level code editing software (SublimeText3)
Hot Topics


 AGI And AI Superintelligence Are Going To Sharply Hit The Human Ceiling Assumption Barrier
Jul 04, 2025 am 11:10 AM
AGI And AI Superintelligence Are Going To Sharply Hit The Human Ceiling Assumption Barrier
Jul 04, 2025 am 11:10 AM
Let’s talk about it. This analysis of an innovative AI breakthrough is part of my ongoing Forbes column coverage on the latest in AI, including identifying and explaining various impactful AI complexities (see the link here). Heading Toward AGI And
 Kimi K2: The Most Powerful Open-Source Agentic Model
Jul 12, 2025 am 09:16 AM
Kimi K2: The Most Powerful Open-Source Agentic Model
Jul 12, 2025 am 09:16 AM
Remember the flood of open-source Chinese models that disrupted the GenAI industry earlier this year? While DeepSeek took most of the headlines, Kimi K1.5 was one of the prominent names in the list. And the model was quite cool.
 Grok 4 vs Claude 4: Which is Better?
Jul 12, 2025 am 09:37 AM
Grok 4 vs Claude 4: Which is Better?
Jul 12, 2025 am 09:37 AM
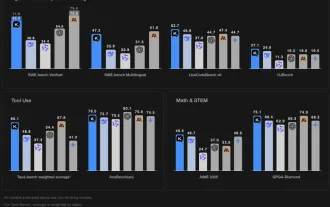
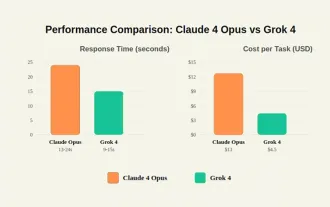
By mid-2025, the AI “arms race” is heating up, and xAI and Anthropic have both released their flagship models, Grok 4 and Claude 4. These two models are at opposite ends of the design philosophy and deployment platform, yet they
 In-depth discussion on how artificial intelligence can help and harm all walks of life
Jul 04, 2025 am 11:11 AM
In-depth discussion on how artificial intelligence can help and harm all walks of life
Jul 04, 2025 am 11:11 AM
We will discuss: companies begin delegating job functions for AI, and how AI reshapes industries and jobs, and how businesses and workers work.
 Premier League Makes An AI Play To Enhance The Fan Experience
Jul 03, 2025 am 11:16 AM
Premier League Makes An AI Play To Enhance The Fan Experience
Jul 03, 2025 am 11:16 AM
On July 1, England’s top football league revealed a five-year collaboration with a major tech company to create something far more advanced than simple highlight reels: a live AI-powered tool that delivers personalized updates and interactions for ev
 10 Amazing Humanoid Robots Already Walking Among Us Today
Jul 16, 2025 am 11:12 AM
10 Amazing Humanoid Robots Already Walking Among Us Today
Jul 16, 2025 am 11:12 AM
But we probably won’t have to wait even 10 years to see one. In fact, what could be considered the first wave of truly useful, human-like machines is already here. Recent years have seen a number of prototypes and production models stepping out of t
 Context Engineering is the 'New' Prompt Engineering
Jul 12, 2025 am 09:33 AM
Context Engineering is the 'New' Prompt Engineering
Jul 12, 2025 am 09:33 AM
Until the previous year, prompt engineering was regarded a crucial skill for interacting with large language models (LLMs). Recently, however, LLMs have significantly advanced in their reasoning and comprehension abilities. Naturally, our expectation
 Chip Ganassi Racing Announces OpenAI As Mid-Ohio IndyCar Sponsor
Jul 03, 2025 am 11:17 AM
Chip Ganassi Racing Announces OpenAI As Mid-Ohio IndyCar Sponsor
Jul 03, 2025 am 11:17 AM
OpenAI, one of the world’s most prominent artificial intelligence organizations, will serve as the primary partner on the No. 10 Chip Ganassi Racing (CGR) Honda driven by three-time NTT IndyCar Series champion and 2025 Indianapolis 500 winner Alex Pa
