


Excel chart formatting skills: improve data visualization effect
This article will share some practical tips to improve the visualization of Excel charts to help you create clearer and more attractive charts. Excel has built-in multiple chart styles, but for the best results, we recommend custom formatting.
1. Add a chart background
The charts need not be boring. Appropriate background can enhance the attractiveness of the chart and make the data clearer and easier to understand.
You can add pictures or colors as backgrounds. For example, using architectural pictures and sunset backgrounds makes the chart more visually impactful.
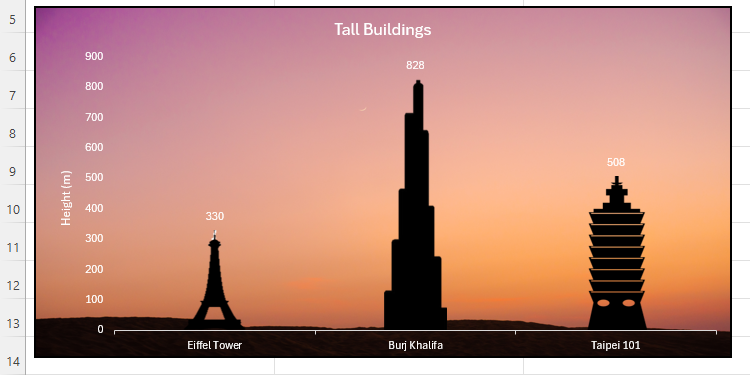
Even subtle color adjustments can make the chart stand out. The key is to have sufficient contrast between the background and the data points to ensure that the chart is easy to read.
How to operate: Double-click the edge of the chart and select the "Fill" menu in the "Format Chart" pane.

Select the fill type, such as "Solid Color Fill" to select the color and adjust the transparency; or select "Picture or Texture Fill" to insert the picture.


Remember, chart legibility is crucial. Avoid using too bright colors or complex textured backgrounds.
2. Adjust the minimum and maximum values ??of the coordinate axis
A clever adjustment of the axis range can make the chart data more efficient in making use of space, avoiding too dense data or unnecessary blanks.


How to operate: Double-click the axis and in the "Format Chart" pane, modify the minimum and maximum values ??in "Borders".


When data changes, the axis range needs to be readjusted to ensure that the chart accurately reflects the data. You can also adjust the Primary Unit and Secondary Units to control the intervals of the axis scales.
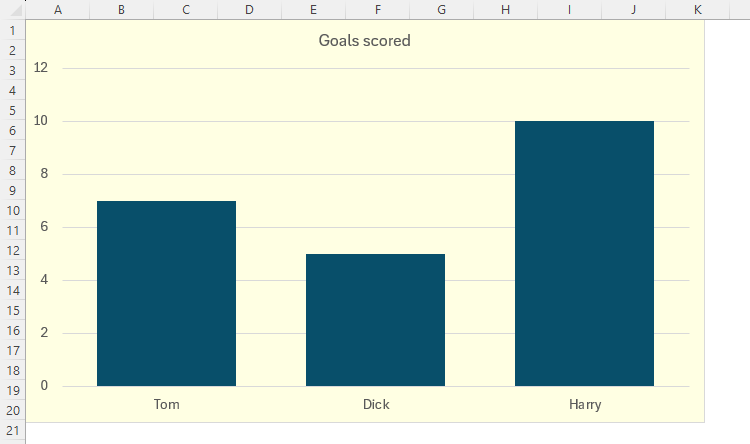
3. Reduce the spacing between bar charts or bar charts
The data point spacing in the Excel chart is expressed as percentages. The default spacing may be too large, affecting data comparison.


How to operate: Right-click the data point, select "Set Data Series Format", and adjust "Space Width" in the "Set Chart Format" pane.

4. Use visual elements in moderation
Avoid excessive complexity of charts. Not all Excel tools are required. Select the right element to achieve the best results.


You can use the chart element button (" sign) to select the desired element.

Or use the Reset to match style button to restore the default style.

5. Delete the worksheet grid line
Worksheet grid lines may affect the readability of the chart, especially if the chart background is transparent or translucent.

Uncheck "Grid Lines" in the View tab to make the chart clearer.

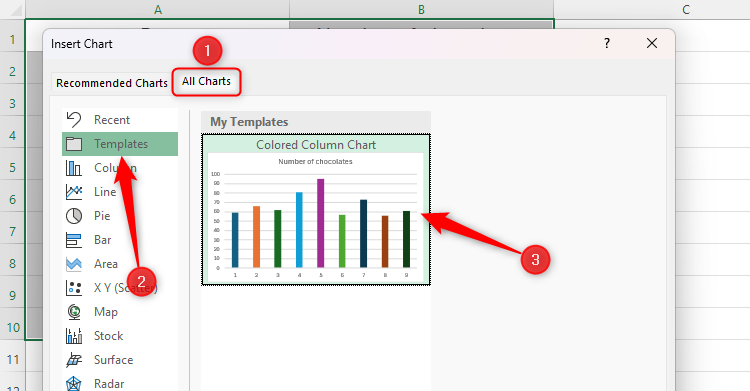
6. Save the chart design as a template
After the chart is finished formatting, save it as a template for reuse in the future.


The key to chart formatting is to optimize readability and maintain consistency. Apart from common pie charts and bar charts, don't forget to try other types of charts such as waterfall charts and sunburst charts.
The above is the detailed content of The 6 Best Tips For Formatting Your Excel Charts. For more information, please follow other related articles on the PHP Chinese website!

Hot AI Tools

Undress AI Tool
Undress images for free

Undresser.AI Undress
AI-powered app for creating realistic nude photos

AI Clothes Remover
Online AI tool for removing clothes from photos.

Clothoff.io
AI clothes remover

Video Face Swap
Swap faces in any video effortlessly with our completely free AI face swap tool!

Hot Article
Hot Tools

Notepad++7.3.1
Easy-to-use and free code editor

SublimeText3 Chinese version
Chinese version, very easy to use

Zend Studio 13.0.1
Powerful PHP integrated development environment

Dreamweaver CS6
Visual web development tools

SublimeText3 Mac version
God-level code editing software (SublimeText3)
Hot Topics


 What is the meeting time limit for the free version of Teams?
Jul 04, 2025 am 01:11 AM
What is the meeting time limit for the free version of Teams?
Jul 04, 2025 am 01:11 AM
MicrosoftTeams’freeversionlimitsmeetingsto60minutes.1.Thisappliestomeetingswithexternalparticipantsorwithinanorganization.2.Thelimitdoesnotaffectinternalmeetingswhereallusersareunderthesameorganization.3.Workaroundsincludeendingandrestartingthemeetin
 how to group by month in excel pivot table
Jul 11, 2025 am 01:01 AM
how to group by month in excel pivot table
Jul 11, 2025 am 01:01 AM
Grouping by month in Excel Pivot Table requires you to make sure that the date is formatted correctly, then insert the Pivot Table and add the date field, and finally right-click the group to select "Month" aggregation. If you encounter problems, check whether it is a standard date format and the data range are reasonable, and adjust the number format to correctly display the month.
 How to Fix AutoSave in Microsoft 365
Jul 07, 2025 pm 12:31 PM
How to Fix AutoSave in Microsoft 365
Jul 07, 2025 pm 12:31 PM
Quick Links Check the File's AutoSave Status
 How to change Outlook to dark theme (mode) and turn it off
Jul 12, 2025 am 09:30 AM
How to change Outlook to dark theme (mode) and turn it off
Jul 12, 2025 am 09:30 AM
The tutorial shows how to toggle light and dark mode in different Outlook applications, and how to keep a white reading pane in black theme. If you frequently work with your email late at night, Outlook dark mode can reduce eye strain and
 how to repeat header rows on every page when printing excel
Jul 09, 2025 am 02:24 AM
how to repeat header rows on every page when printing excel
Jul 09, 2025 am 02:24 AM
To set up the repeating headers per page when Excel prints, use the "Top Title Row" feature. Specific steps: 1. Open the Excel file and click the "Page Layout" tab; 2. Click the "Print Title" button; 3. Select "Top Title Line" in the pop-up window and select the line to be repeated (such as line 1); 4. Click "OK" to complete the settings. Notes include: only visible effects when printing preview or actual printing, avoid selecting too many title lines to affect the display of the text, different worksheets need to be set separately, ExcelOnline does not support this function, requires local version, Mac version operation is similar, but the interface is slightly different.
 How to Screenshot on Windows PCs: Windows 10 and 11
Jul 23, 2025 am 09:24 AM
How to Screenshot on Windows PCs: Windows 10 and 11
Jul 23, 2025 am 09:24 AM
It's common to want to take a screenshot on a PC. If you're not using a third-party tool, you can do it manually. The most obvious way is to Hit the Prt Sc button/or Print Scrn button (print screen key), which will grab the entire PC screen. You do
 How to change your name in Microsoft Teams?
Jul 03, 2025 am 02:01 AM
How to change your name in Microsoft Teams?
Jul 03, 2025 am 02:01 AM
To change the name in Microsoft Teams, take different steps based on the account type. For personal Microsoft accounts, you can go to account.microsoft.com to modify your name and sync it to Teams; for work or school accounts, the administrator needs to update it in the Microsoft 365 Admin Center; in addition, the display name can be temporarily changed before joining the meeting, but it will only take effect for the current meeting. All changes may take hours to sync and may be due to cache displaying old names in chat history or meeting playback.
 Where are Teams meeting recordings saved?
Jul 09, 2025 am 01:53 AM
Where are Teams meeting recordings saved?
Jul 09, 2025 am 01:53 AM
MicrosoftTeamsrecordingsarestoredinthecloud,typicallyinOneDriveorSharePoint.1.Recordingsusuallysavetotheinitiator’sOneDriveina“Recordings”folderunder“Content.”2.Forlargermeetingsorwebinars,filesmaygototheorganizer’sOneDriveoraSharePointsitelinkedtoaT
