

How to monitor system performance
Sep 16, 2025 am 12:04 AM
System performance monitoring requires attention to four core aspects: CPU, memory, disk IO and network. First, use top/htop to view CPU usage, focusing on user status (us), system status (sy) and idle status (id). Us is consistently higher than 70% and program usage may be too high, while sy is high may cause frequent system calls; it is recommended to use mpstat to check regularly, combine Prometheus Node Exporter to set alarms, or use cloud vendor monitoring panel. Secondly, view the memory through free -h, focus on the available field. If it is close to zero, you need to optimize the program or increase the memory; note that cache usage and the increase in swap usage are memory pressure signals, which can be alleviated by adjusting the swappiness parameters. Third, use iostat/iotop to monitor disk read and write, df -h to check disk space, especially root directory and log directory; %util is close to 100% to indicate that the disk is saturated, and hardware needs to be upgraded or load balancing is required. Finally, use ping/traceroute to detect latency and iftop/nload to view bandwidth; pay special attention to the network between containers and DNS resolution speed (can be tested by dig). Monitoring should be continuously observed and key modules are selected as needed, rather than covering all content at once.

Monitoring the performance of the system is actually not difficult, the key is to find the right tools and focus. If you find that the server responds slowly, the application is stuttering, or you want to prevent failures in advance, system monitoring is the skill you must master.
Keep a close eye on CPU usage
CPU is one of the core resources for system operation and can easily become a bottleneck when high loads are available. You can use top or htop (more intuitive) to view CPU usage in real time. Focus on the ratio of user state (us), system state (sy) and idle (id). If the us is higher than 70% for a long time, it may mean that your program consumes too much CPU; if the sy is high, it may cause frequent system calls.
suggestion:
- Regularly use
mpstatto view detailed CPU metrics (sysstat needs to be installed) - Set up monitoring alarms, such as using Prometheus Node Exporter for long-term tracking
- If it is a cloud server, you can directly use the monitoring panel provided by the manufacturer
Memory and swap partition differences are ignored
Insufficient memory can cause the system to start using swap (swap partition), which can significantly slow down performance. Use free -h to quickly view current memory usage. Focus on the "available" field, which indicates the truly available memory. If this value is often close to zero, it means you need to optimize the program or increase memory.
FAQ:
- The system looks like "still memory", but in fact, the cache occupies a lot of space (this part can be released)
- The increase in Swap usage is usually a signal of memory pressure, not a normal phenomenon
Solutions include:
- Adjust the application's memory usage
- Reasonably set the swappiness parameter of Linux (the default is 60, the lower the value, the less likely it is to use swap)
Disk IO and file system must also be checked
The disk read and write speed directly affects database, log processing and other operations. You can use iostat or iotop to see which processes are reading and writing to disk in a crazy way. df -h can help you check whether the disk space is almost full, especially the root directory / and log directory /var/log .
Notice:
- If
%utilis close to 100%, it means that the disk is saturated and may need to be upgraded to SSD or load balancing. - File system type will also affect performance, for example, ext4 and xfs perform differently in processing large files.
Network latency and bandwidth cannot be leaked
Network problems often disguise themselves as other failures. For example, a service is slow to respond, which may not be a problem with the code, but a high network latency or insufficient bandwidth. You can use ping and traceroute to check network connectivity and latency, and use iftop or nload to view bandwidth usage in real time.
Special reminder:
- If you are using Docker or Kubernetes, you should also pay attention to the network status between containers
- Slow DNS resolution will also cause overall service to slow down. You can use
digto test the resolution time.
Basically these aspects. The monitoring system performance does not require full control at once, just select key modules as needed. The key is to establish a habit of continuous observation, rather than waiting until something goes wrong before cramming.
The above is the detailed content of How to monitor system performance. For more information, please follow other related articles on the PHP Chinese website!

Hot AI Tools

Undress AI Tool
Undress images for free

Undresser.AI Undress
AI-powered app for creating realistic nude photos

AI Clothes Remover
Online AI tool for removing clothes from photos.

ArtGPT
AI image generator for creative art from text prompts.

Stock Market GPT
AI powered investment research for smarter decisions

Hot Article
Hot Tools

Notepad++7.3.1
Easy-to-use and free code editor

SublimeText3 Chinese version
Chinese version, very easy to use

Zend Studio 13.0.1
Powerful PHP integrated development environment

Dreamweaver CS6
Visual web development tools

SublimeText3 Mac version
God-level code editing software (SublimeText3)

 How long is home monitoring usually kept?
Aug 30, 2023 pm 04:44 PM
How long is home monitoring usually kept?
Aug 30, 2023 pm 04:44 PM
Home monitoring is generally kept for one to two weeks. Detailed introduction: 1. The larger the storage capacity, the longer the video can be saved; 2. The larger the capacity of the hard disk, the longer the video can be saved; 3. According to the requirements of different regions and laws and regulations, the number of surveillance videos The storage time may vary; 4. Some advanced surveillance systems can also trigger recording based on motion detection or specific events, thereby saving storage space and providing more useful recordings.
 How to implement request logging and monitoring in FastAPI
Jul 30, 2023 am 08:29 AM
How to implement request logging and monitoring in FastAPI
Jul 30, 2023 am 08:29 AM
How to implement request logging and monitoring in FastAPI Introduction: FastAPI is a high-performance web framework based on Python3.7+. It provides many powerful functions and features, including automated request and response model verification, security, and performance optimization. wait. In actual development, we often need to record request logs in the application for debugging and monitoring analysis. This article will introduce how to implement request logging and monitoring in FastAPI and provide corresponding code examples. 1. Installation
 Python script for monitoring website changes
Aug 29, 2023 pm 12:25 PM
Python script for monitoring website changes
Aug 29, 2023 pm 12:25 PM
In today's digital age, being aware of the latest changes on your website is crucial for a variety of purposes, such as tracking updates on your competitors' websites, monitoring product availability, or staying informed of important information. Manually checking your website for changes can be time-consuming and inefficient. This is where automation comes into play. In this blog post, we will explore how to create a Python script to monitor website changes. By leveraging the power of Python and some handy libraries, we can automate the process of retrieving website content, comparing it to previous versions, and notifying us of any changes. This allows us to remain proactive and react promptly to updates or modifications to the sites we monitor. Setting up the environment Before we start writing scripts to monitor website changes, we need to set up P
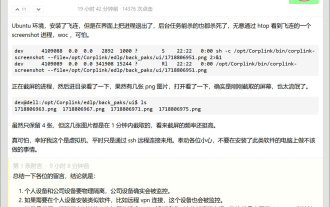 Byte Feilian accused of monitoring screenshots? Relevant person: It is the enterprise that has turned on the data leakage prevention function
Jun 21, 2024 pm 09:47 PM
Byte Feilian accused of monitoring screenshots? Relevant person: It is the enterprise that has turned on the data leakage prevention function
Jun 21, 2024 pm 09:47 PM
According to news on the afternoon of June 21, recently, some netizens said that after installing FeiLian (FeiLian is an office platform used internally by ByteDance and open to the public), they accidentally discovered that FeiLian was executing a screenshot process in the background. The user It reminds everyone not to do things you shouldn't do on computers with such software installed. Sina Technology asked ByteDance about this, and relevant sources said that Feilian provides data security protection functions for corporate customers. Enterprises can set the functional configuration of automated audit policies based on their own business needs and data sensitivity. The situation described in the forum post is that the enterprise administrator has enabled the DLP (data leakage prevention) function on the device that stores sensitive data. Felian will cycle through sensitive devices with DLP enabled at certain intervals.
 Will Sunflower Remote Control be monitored? Will Sunflower Remote Control reveal privacy?
Mar 15, 2024 pm 05:28 PM
Will Sunflower Remote Control be monitored? Will Sunflower Remote Control reveal privacy?
Mar 15, 2024 pm 05:28 PM
Will Sunflower remote control be monitored? Sunflower remote control software can help users quickly retrieve information from another computer, etc. However, there are also many users who are worried about the security of their own computers. Let the editor answer these questions for users. Question. Will Sunflower Remote Control be monitored? Answer: No. Although Sunflower Remote Control has the ability to do this, large software companies like Sunflower Remote Control that have been established for many years will not do such a thing. For office workers, perhaps a piece of software that must be installed on the computer is remote control. For many people, whether they are working from home or because they are unable to leave, operating the current computer from a distance through another computer can save a lot of time.
 C# Development Advice: Logging and Monitoring Systems
Nov 22, 2023 pm 08:30 PM
C# Development Advice: Logging and Monitoring Systems
Nov 22, 2023 pm 08:30 PM
C# Development Suggestions: Logging and Monitoring System Summary: In the software development process, logging and monitoring systems are crucial tools. This article will introduce the role and implementation suggestions of logging and monitoring systems in C# development. Introduction: Logging and monitoring are essential tools in large-scale software development projects. They can help us understand the running status of the program in real time and quickly discover and solve problems. This article will discuss how to use logging and monitoring systems in C# development to improve software quality and development efficiency. The role of logging system
 Laravel monitoring errors: improve application stability
Mar 06, 2024 pm 04:48 PM
Laravel monitoring errors: improve application stability
Mar 06, 2024 pm 04:48 PM
Monitoring errors in Laravel is an important part of improving application stability. During the development process, various errors will inevitably be encountered, and how to detect and resolve these errors in a timely manner is one of the keys to ensuring the normal operation of the application. Laravel provides a wealth of tools and functions to help developers monitor and handle errors. This article will introduce some of the important methods and attach specific code examples. 1. Use logging Logging is one of the important means of monitoring errors. Laravel has a powerful logging system built-in, developers
 How to use Docker for container monitoring and performance analysis
Nov 08, 2023 am 09:54 AM
How to use Docker for container monitoring and performance analysis
Nov 08, 2023 am 09:54 AM
Overview of how to use Docker for container monitoring and performance analysis: Docker is a popular containerization platform that allows applications to run in independent containers by isolating applications and their dependent software packages. However, as the number of containers increases, container monitoring and performance analysis become increasingly important. In this article, we will introduce how to use Docker for container monitoring and performance analysis, and provide some specific code examples. Use Docker’s own container monitoring tool Docker provides
