Found a total of 10000 related content
Visualize Your Data And Speed Up Your Site With Dynamic Chart Libraries
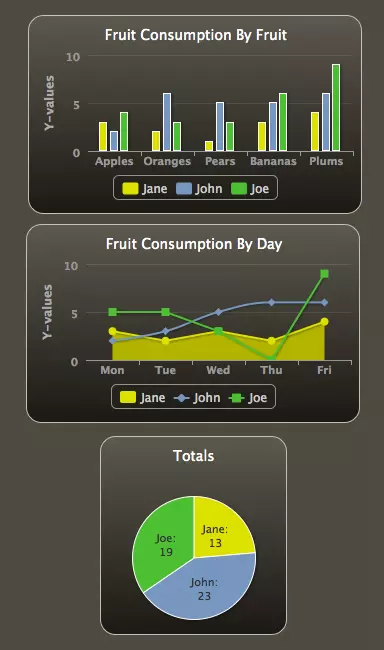
Article Introduction:Create a data visual interface that combines aesthetics and efficiency. Designers should strive to create interfaces that are not only visually attractive, but also flexible and efficient. Data visualization should strike a balance between aesthetics and practicality.
Dynamic Chart Library provides a practical solution for data visualization, allowing real-time updates, interactivity, and significantly reducing page loading time for a smoother user experience.
There are a variety of dynamic chart libraries to choose from, each with its pros and cons, including HighCharts, PlotKit, d3.js, FusionCharts, Google Chart Tools, and Flot. These libraries range from simple, free to powerful and expensive.
Dynamic chart library can process large amounts of data and supports various charts
2025-02-27
comment 0
547

How to use ECharts to enable data visualization in front-end projects?
Article Introduction:Using ECharts to implement data visualization mainly includes the following steps: 1. Install the ECharts library through npm or yarn; 2. Create a chart container in HTML; 3. Initialize the ECharts instance in JavaScript and configure chart options; 4. Optimize the performance of large data volume, such as data paging, data sampling and using WebGL; 5. Add chart interactivity, such as listening to click events; 6. Use the connect function to achieve multiple chart linkage. ECharts is a powerful and flexible chart library that meets most data visualization needs.
2025-05-20
comment 0
350

One more library to create graphics in react.js projects
Article Introduction:When visual data can be visualized in React applications, it is important to choose a suitable chart library. In the React ecosystem, Nivo is one of the best choices. The library is known for its ability, ease of use, and capable of creating visual attractive and highly customized charts.
Why choose nivo?
1. Integration with React and D3
Nivo is built on React and D3.js, which means that it combines the advantages of the two technology. D3.JS is famous for its powerful data document operation capabilities, while React provides an efficient way to build a user interface. This combination enables Nivo to provide interactive and dynamic charts that perfectly integrate with React applications.
2. A variety of chart types
2025-01-28
comment 0
576
LightningChart JS v. has been released!
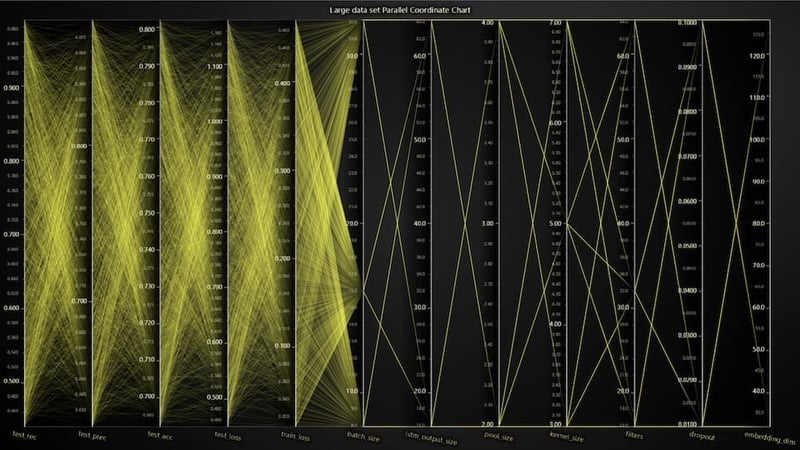
Article Introduction:Hey there, I'm glad to share with you the new release of LightningChart JS 6.1. If you have read my previous articles, you may have seen that LightningChart JS is the library behind all our chart tutorials.
So, here's some information about the rele
2024-11-06
comment 0
761

Creating Charting Directives Using AngularJS and D3.js
Article Introduction:Core points
D3.js is a JavaScript library that can be used in conjunction with AngularJS to create interactive real-time charts with SVG (scalable vector graphics). This combination allows developers to create rich web applications with dynamic data visualization.
AngularJS and D3.js can be set in HTML pages to create chart directives. This includes creating AngularJS controllers and instructions and using the controller to save the data to be drawn in the chart. Then, you can use this directive to draw a line chart using D3.js.
The chart can be updated in real time to reflect changes in the underlying data. This can be done by using a collection observer in the instruction to monitor changes in the collection data and then detect
2025-02-21
comment 0
611

Learn to Create D3.js Data Visualizations by Example
Article Introduction:D3.js: Draw dynamic data visualization with JavaScript
This article discusses D3.js, a powerful JavaScript library for creating dynamic and interactive data visualizations. It uses HTML, SVG and CSS to render data in web browsers.
Core points:
D3.js is a versatile JavaScript library that allows developers to create dynamic, interactive data visualizations in web browsers using HTML, SVG and CSS.
The library provides a wealth of tools for data processing, converting raw data into meaningful visual representations and can be widely customized to suit unique creative ideas.
D3.js uses scale bar to map data values ??to vision
2025-02-17
comment 0
1102

ONCSS
Article Introduction:oncss
oncss is a CSS-in-JS library that provides developers with a powerful css function to style their web applications. It enables modern styling techniques, including nested selectors, responsive design, and dynamic keyframes, all while offe
2025-01-05
comment 0
946

Getting Started With Chart.js: Axes and Scales
Article Introduction:In the first four tutorials, you have learned a lot about Chart.js. After reading the first four tutorials, you should be able to customize tooltips and tags, change fonts, and create different types of charts. This series of tutorials has not yet introduced an aspect of Chart.js: axis and scale.
The scale has changed a lot since the v1.0 version of the library and is now more powerful. In this tutorial, you will learn how to manipulate the scale and use the different options provided by the library to control its appearance.
Change grid lines and axis labels
All configuration options for grid lines are nested under the scale options for title and font keys.
Below is a chart of the same old car speed specified with a set of different chart options.
var chartOp
2025-03-15
comment 0
294

What are the websites that can watch the market for free in the currency circle? Bitcoin Market Website App
Article Introduction:For cryptocurrency investors, the following 7 free market tools are the most popular and powerful: 1. Binance provides comprehensive market data such as real-time price, K-line chart and depth chart; 2. The Ouyi interface is simple and intuitive, supports the superposition and analysis of a variety of technical indicators and can create customized attention lists; 3. TradingView is a professional chart analysis platform, gathers global exchange data and provides a massive technical indicator library; 4. CoinMarketCap focuses on macro market data, such as total market value, currency ranking and exchange trading volume ranking, and provides portfolio tracking functions; 5. Huobi covers a wide range of currencies, provides real-time quotations and smooth K-line charts, while integrating industry information and research reports; 6. Gate.io uses massive currencies to massive currencies.
2025-07-09
comment 0
924

HTML for Data Visualization Integration
Article Introduction:HTML itself cannot directly realize data visualization, but it can be done as a structural layer basis with other tools. 1. HTML is responsible for building the page skeleton and providing chart containers, such as for SVG or DOM charts, for pixel-level drawing. 2. Implement graphic drawing by introducing libraries such as D3.js, Chart.js or ECharts. For example, initializing a line chart with Chart.js requires introducing scripts and configuring data and styles. 3. Responsive and interactive design can improve experience and performance through CSS media query, window redraw monitoring, library-owned tooltip function and lazy loading mechanism.
2025-07-17
comment 0
690

A Beginner's Guide to Data Binding in D3.js
Article Introduction:D3.js Data Visualization: The Magical Use of Data Binding
D3.js has become a powerful data visualization library with its declarative programming style, but its learning curve is quite challenging for beginners. This article will explain the core concepts in D3.js - Data Binding or Data Joins - in an easy-to-understand way to help you get started easily.
The data binding process is like growing vegetables:
Select a plot (SVG): First, you need to select the area to draw the visualization, just like choosing a vegetable field.
Digging (selectAll): The selectAll() function is similar to digging a pit. It creates a container for subsequently added elements.
2025-02-18
comment 0
852

Frontend Data Visualization with D3.js or Chart.js
Article Introduction:Choose D3.js to be suitable for highly customized and complex visualization needs, such as maps, topology maps, etc., and you need to master SVG and DOM operations; 1. Chart.js is more suitable for quickly implementing common charts, with simple configuration, supports mainstream frameworks, and is suitable for scenarios with short project cycles and common chart types; 2. Decide which library to choose based on whether you need to be highly customized and whether you have development resources; 3. Newbie recommends getting started with Chart.js and then gradually learn the modular components of D3.
2025-07-19
comment 0
509

Dave The Diver: How To Catch Spider Crabs
Article Introduction:In Dave The Diver, there are some creatures that are not easy to catch. Or, catch alive that is. The spider crab is one of those very species, making it seem like the only way to bring these crustaceans back up to land is to viciously crack them up w
2025-01-10
comment 0
864

Prepare for Interview Like a Pro with Interview Questions CLI
Article Introduction:Prepare for Interview Like a Pro with Interview Questions CLI
What is the Interview Questions CLI?
The Interview Questions CLI is a command-line tool designed for JavaScript learners and developers who want to enhance their interview
2025-01-10
comment 0
1491


