

Technical analysis of Stochastic RSI
Jul 30, 2025 pm 08:21 PM
Table of contents
- What is fundamental analysis?
- What is technical analysis?
- What is a lag indicator?
- What is a leading indicator?
- Understand random RSI:
- The difference between RSI and random RSI:
- How does StochRSI work?
- How to interpret Stochastic RSI metrics?
- How to calculate random RSI?
- Conclusion
The Stochastic RSI is a technical tool used to evaluate the strength of assets over a specific period of time. The numerical value of this indicator is calculated based on RSI and is one of the important means used by analysts to identify market trends and predict future price trends.
What is fundamental analysis?
Fundamental analysis focuses on examining the project itself, its social ecology, and related news events. This method covers research on multiple aspects of the project, such as team background, technology implementation, market positioning and industry trends. It is often called a top-down analysis method, suitable for investors who want to judge their long-term value by deeply understanding the fundamentals of a crypto asset. In contrast, technical analysis focuses on the price chart pattern, finds rules through historical data, and then speculates on possible future price paths, including key elements such as trend direction, fluctuation characteristics, support and resistance levels.
What is technical analysis?
The core of technical analysis is to use historical price and trading volume data to understand market behavior. It helps traders identify potential price patterns and make decisions based on them. This process usually relies on various technical indicators to reveal trend intensity, momentum changes and reversal signals. Each trader's indicator combination varies depending on the individual strategy. For beginners, it is crucial to master the functions of each indicator and its application scenarios. Random RSI is one of the widely used indicators that helps capture opportunities for short-term price fluctuations.
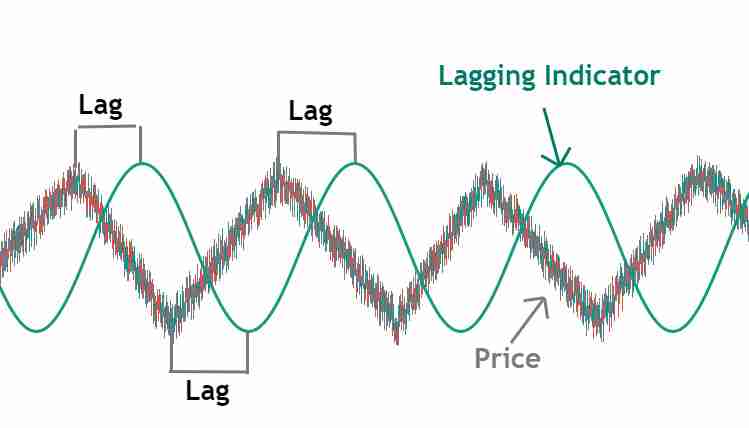
What is a lag indicator?
The lag indicator reflects the market changes that have occurred, and the signal usually appears after the trend is formed. Such indicators help confirm the existence of the trend and provide investors with a more stable reference basis. The term "market idea" refers to the collective expectations of market participants for the future trend, and the lagging indicator is the reflection of this expectation in the price trend.
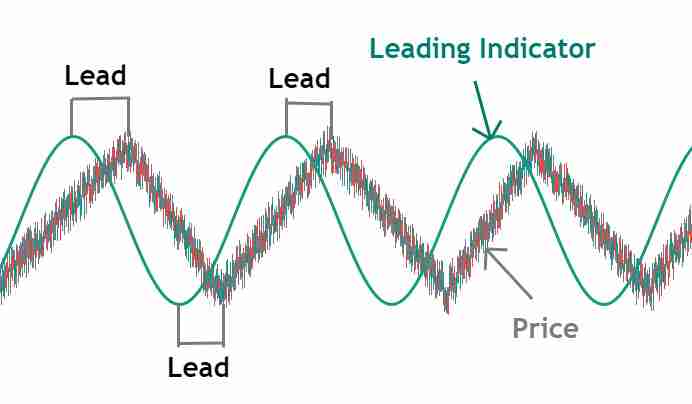
What is a leading indicator?
Leading indicators aim to indicate the direction of price movements in advance and help traders react early in the trend. These indicators provide additional guidance when the chart trend is not clear enough. They serve as technical tools to help understand the price direction of a particular asset and its potential response to major events. Among them, random RSI and Bollinger bands are relatively popular leading indicators and are widely used in trend identification and trading timing judgment.
Understand random RSI:
Random RSI combines the characteristics of two commonly used momentum indicators: one measures the recent price fluctuations and the other assesses the current price relative to past performance. When an asset rises rapidly in a very short period of time, it may indicate the risk of a pullback in the short term. Nevertheless, if the asset has continued to rise for many days, a comprehensive judgment is required based on other factors.
The difference between RSI and random RSI:
RSI (relative strength index) reflects the overbought or oversold status of assets by performing an exponential weighted average of price changes. StochRSI (StochRSI) applies the calculation method of the random oscillator to the RSI value itself, forming a new indicator that fluctuates between 0 and 1 (or 0-100 interval, depending on the setting). This makes StochRSI more sensitive to short-term fluctuations in RSI and can send buying and selling signals faster. Since its calculations are based on RSI rather than the original price, momentum changes can be revealed more finely.
How does StochRSI work?
StochRSI is generated by applying standard random formulas to RSI sequence data, and the result is a value between 0 and 1, fluctuating around the midline of 0.5. Some versions multiply the result by 100, making its range from 0 to 100, and the center line is 50. In addition, many charts will add a 3-day simple moving average as signal line to filter noise and reduce misjudgment.
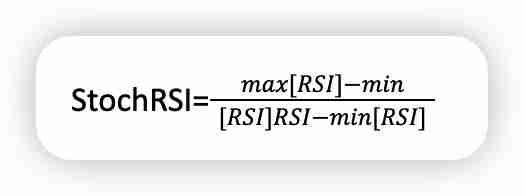
The calculation formula is as follows:
StochRSI = (current RSI - lowest RSI in the last 14 periods) / (highest RSI in the last 14 periods - lowest RSI in the last 14 periods)
The most commonly used period is 14, but can be adjusted according to the trading style. The time unit can be days, hours, or minutes. For example, on the daily chart, the 14 cycle represents the past 14 trading days; on the hourly chart, it is 14 hours. 20 cycles are also one of the common choices.
When the indicator is above 80 (or 0.8), it is considered overbought; if it is below 20 (or 0.2), it is oversold. Although the numerical ranges are different, their market meanings are consistent.
How to interpret Stochastic RSI metrics?
StochRSI is most valuable when approaching the extreme value area. Mainly used to identify potential buying or selling opportunities, as well as trend reversal signals. It is generally believed that a reading of ≤0.2 means that the asset may be in an oversold state and has rebound potential; ≥0.8 means that it is overbought and may cause a pullback.
At the same time, the trend around the mid-line 0.5 can also reveal the trend direction. If StochRSI runs stably above 0.5 and gradually rises, it may mean that the upward trend continues; on the contrary, if it continues to fall below 0.5 and approaches 0.2, it implies that the downward trend is strengthening.
How to calculate random RSI?
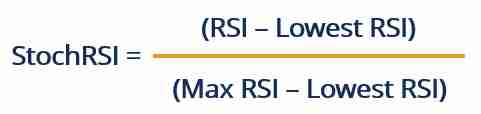
The calculation of random RSI depends on the following formula:
in:
RSI = Current RSI value
min [RSI] = Minimum RSI value in the last 14 cycles
max [RSI] = Maximum RSI value in the last 14 cycles
Random RSI is designed to determine whether an asset enters an overbought or oversold area, thereby guiding trading decisions. The calculation steps include:
- Collect RSI data for 14 consecutive cycles;
- Determines the RSI value of the current cycle, as well as the highest and lowest RSIs in the past 14 cycles;
- Substitute the formula to calculate the current StochRSI;
- Each new cycle is added, the data window is updated and recalculated.
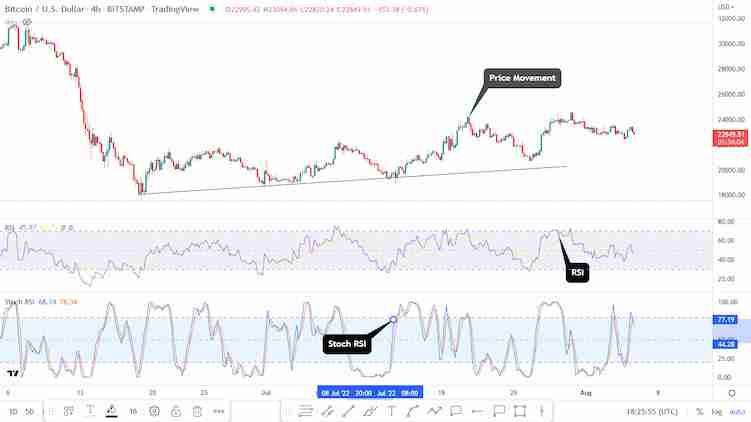
Random RSI combines the relationship between price changes and the closing price of the previous period, and is a medium- and short-term momentum indicator and is suitable for trading scenarios. It integrates the dual mechanisms of measuring the rise and fall and relative position, and improves the speed of response to changes in market sentiment. The above figure shows the comparison between Bitcoin's RSI and random RSI, which shows that the latter is more sensitive to price fluctuations. A slight rise can trigger an overbought signal (such as more than 77), and the same is true for the decline. Therefore, it is an effective tool for traders to monitor trend changes.
Conclusion
Since Stochastic RSI is extremely sensitive to market volatility and can quickly reflect price momentum changes, it has important reference value for traders and analysts and is suitable for short-term trading or trend confirmation.
However, high sensitivity also means more false signals, especially in the highly volatile crypto market. Therefore, it is recommended to use it in combination with other technical tools such as MACD, moving average systems or volumes to improve signal reliability. Relying on StochRSI alone may lead to misjudgment, and comprehensive analysis is the key to a stable transaction.
The above is the detailed content of Technical analysis of Stochastic RSI. For more information, please follow other related articles on the PHP Chinese website!

Hot AI Tools

Undress AI Tool
Undress images for free

Undresser.AI Undress
AI-powered app for creating realistic nude photos

AI Clothes Remover
Online AI tool for removing clothes from photos.

Clothoff.io
AI clothes remover

Video Face Swap
Swap faces in any video effortlessly with our completely free AI face swap tool!

Hot Article
Hot Tools

Notepad++7.3.1
Easy-to-use and free code editor

SublimeText3 Chinese version
Chinese version, very easy to use

Zend Studio 13.0.1
Powerful PHP integrated development environment

Dreamweaver CS6
Visual web development tools

SublimeText3 Mac version
God-level code editing software (SublimeText3)
Hot Topics


 What are the websites for real-time price query of Bitcoin? Recommended websites that can view Bitcoin K-line and depth chart
Jul 31, 2025 pm 10:54 PM
What are the websites for real-time price query of Bitcoin? Recommended websites that can view Bitcoin K-line and depth chart
Jul 31, 2025 pm 10:54 PM
In the digital currency market, real-time mastering of Bitcoin prices and transaction in-depth information is a must-have skill for every investor. Viewing accurate K-line charts and depth charts can help judge the power of buying and selling, capture market changes, and improve the scientific nature of investment decisions.
 Top 10 trading software in the currency circle Download the top 10 exchange app in the currency circle
Jul 31, 2025 pm 07:15 PM
Top 10 trading software in the currency circle Download the top 10 exchange app in the currency circle
Jul 31, 2025 pm 07:15 PM
This article lists the top ten trading software in the currency circle, namely: 1. Binance, a world-leading exchange, supports multiple trading modes and financial services, with a friendly interface and high security; 2. OKX, rich products, good user experience, supports multilingual and multiple security protection; 3. gate.io, known for strict review and diversified trading services, attaches importance to community and customer service; 4. Huobi, an old platform, has stable operations, strong liquidity, and has a great brand influence; 5. KuCoin, has large spot trading volume, rich currency, low fees, and diverse functions; 6. Kraken, a US compliance exchange, has strong security, supports leverage and OTC trading; 7. Bitfinex, has a long history, professional tools, suitable for high
 The Ethereum price rose by more than 20% in 7 days. What is the reason behind it?
Jul 31, 2025 pm 10:48 PM
The Ethereum price rose by more than 20% in 7 days. What is the reason behind it?
Jul 31, 2025 pm 10:48 PM
The recent surge of Ethereum price by more than 20% is mainly driven by four major factors: 1. The Cancun Upgrade is approaching, especially the "prototype data sharding" technology introduced by EIP-4844 will significantly reduce the transaction costs of Layer 2, improve network scalability, and attract investors to make advance arrangements; 2. The DeFi ecosystem continues to flourish, and the total value of locked positions (TVL) has grown steadily. New protocols such as liquid staking derivatives (LSD) and restaking (Restaking) have risen, increasing the rigid demand for ETH as a Gas fee and pledged assets; 3. The market has strong expectations for the approval of Ethereum spot ETF, believing that it will provide convenient channels for institutional investors, introduce a large amount of funds and enhance market confidence.
 How to adjust the asset position in the currency circle to a suitable proportion according to market trends
Jul 31, 2025 pm 06:33 PM
How to adjust the asset position in the currency circle to a suitable proportion according to market trends
Jul 31, 2025 pm 06:33 PM
First, we need to judge the type of market trend. 1. The upward trend is manifested as a step-by-step price increase and the trading volume is moderately amplified. The position can be controlled at 60%-80%, and some returns can be gradually realized; 2. The downward trend is showing a continuous downward trend and the trading volume may fall in volume. The position should be reduced to 20%-40%, and the loss should be reduced in time to avoid the expansion of losses; 3. The sideways fluctuation trend is limited and the long and short balance is balanced. It is recommended that the position be kept at 40%-60%, and the range bands should be used; when adjusting, it is necessary to combine its own risk tolerance, avoid frequent operations, adhere to the diversified allocation of assets, and dynamically track trend changes to respond in a timely manner, ensure that the position strategy is consistent with the market trend, and ultimately achieve scientific asset management and risk control.
 Digital Currency Recharge Safety Guide: Prevent Operational Mistakes
Jul 31, 2025 pm 10:33 PM
Digital Currency Recharge Safety Guide: Prevent Operational Mistakes
Jul 31, 2025 pm 10:33 PM
1. Choose a reputable trading platform; 2. Confirm currency and network type; 3. Check the official recharge address; 4. Ensure the network security environment; 5. Double check the head and tail characters of the address; 6. Confirm the amount and decimal points; 7. Pay attention to the minimum recharge amount; 8. Fill in necessary labels or notes; 9. Beware of clipboard hijacking; 10. Don’t trust the non-official channel address; 11. Test the small amount before large recharge; 12. Save the transaction ID for inquiry; 13. Wait patiently for network confirmation; 14. Contact customer service in time when the account is not arrived. To ensure the safety of digital currency recharge, the above steps must be strictly followed. From platform selection to information verification to risk prevention, every step needs to be carefully operated. Finally, through retaining vouchers and timely communication, the asset is securely received, and avoid negligence.
 What is Ethereum? What are the ways to obtain Ethereum ETH?
Jul 31, 2025 pm 11:00 PM
What is Ethereum? What are the ways to obtain Ethereum ETH?
Jul 31, 2025 pm 11:00 PM
Ethereum is a decentralized application platform based on smart contracts, and its native token ETH can be obtained in a variety of ways. 1. Register an account through centralized platforms such as Binance and Ouyiok, complete KYC certification and purchase ETH with stablecoins; 2. Connect to digital storage through decentralized platforms, and directly exchange ETH with stablecoins or other tokens; 3. Participate in network pledge, and you can choose independent pledge (requires 32 ETH), liquid pledge services or one-click pledge on the centralized platform to obtain rewards; 4. Earn ETH by providing services to Web3 projects, completing tasks or obtaining airdrops. It is recommended that beginners start from mainstream centralized platforms, gradually transition to decentralized methods, and always attach importance to asset security and independent research, to
 What is a digital currency strategy order? What should you pay attention to when doing a strategy order
Jul 31, 2025 pm 06:39 PM
What is a digital currency strategy order? What should you pay attention to when doing a strategy order
Jul 31, 2025 pm 06:39 PM
The digital currency strategy list is an operation plan based on preset rules and market analysis, used to guide digital currency transactions. The core is to respond to market fluctuations through early planning; 1. The strategy list includes entry opportunities, target points, and ways to deal with fluctuations, aiming to reduce operational arbitraryness; 2. It is necessary to formulate it in combination with your own risk tolerance and cognitive level to avoid blindly applying other people's strategies. Novice should start with simple strategies; 3. The strategy should be adjusted in a timely manner according to market dynamics, and continue to pay attention to industry information and emotional changes to maintain effectiveness; 4. Risk response plans must be planned in advance to avoid panic operations in emergencies, and potential risks should be reduced by diversifying investments to ensure overall stability. The above key points together form a complete and executable strategy system.
 Why does Binance account registration fail? Causes and solutions
Jul 31, 2025 pm 07:09 PM
Why does Binance account registration fail? Causes and solutions
Jul 31, 2025 pm 07:09 PM
The failure to register a Binance account is mainly caused by regional IP blockade, network abnormalities, KYC authentication failure, account duplication, device compatibility issues and system maintenance. 1. Use unrestricted regional nodes to ensure network stability; 2. Submit clear and complete certificate information and match nationality; 3. Register with unbound email address; 4. Clean the browser cache or replace the device; 5. Avoid maintenance periods and pay attention to the official announcement; 6. After registration, you can immediately enable 2FA, address whitelist and anti-phishing code, which can complete registration within 10 minutes and improve security by more than 90%, and finally build a compliance and security closed loop.