

Predict Employee Attrition with SHAP: An HR Analytics Guide
Jul 16, 2025 am 09:09 AM
Key skills employees leave the company. This departure happens so suddenly that employee turnover becomes an unbearable and costly and destructive problem for the company. Why? Because recruiting and training an outside person who is completely unfamiliar with the details of the company requires a lot of time and money.
In the face of this situation, whenever your colleague leaves the office where you work, a problem always comes to your mind:
“What if we could predict who might leave and understand why?”
But these assumptions are somehow wrong before assuming that employee turnover is just a disconnect at work, or better learning/growth opportunities exist elsewhere.
So, no matter what happens in your office, you will see them going out more than they enter.
But if you don't observe a pattern, you're ignoring the full significance of the employee turnover that is happening in real time in your office.
You might be wondering: “Are the company and its HR departments trying to prevent valuable employees from leaving?”
Yes! Therefore, in this article, we will build a simple machine learning model to predict employee turnover and interpret the results using SHAP tools so that HR teams can act based on these insights.
Table of contents
- Problem understanding
- Analysis on how to help human resources respond proactively
- What is the SHAP method?
- Dataset Overview
- 5 steps to SHAP tools/methods
- Revise the plan
- in conclusion
- FAQ
Problem understanding
In 2024, the market data report released by WorldMetrics clearly stated that 33% of employees left because they did not see opportunities for career development—that is, one-third of them left because of stagnant growth paths. Therefore, out of 180 employees each year, 60 employees will resign and leave the company. So, what is employee turnover? You might ask us this.
- What is employee turnover?
Gartner, a world-renowned consulting firm, has provided insight and professional guidance to clients over the past 45 years, defining employee turnover as “the gradual loss of employees when positions are not filled, often due to voluntary resignation, retirement or internal transfer.”
Analysis on how to help human resources respond proactively
The HR department is extremely reliable and valuable to the company because HR is the only department that can actively handle employee turnover analysis and HR.
HR departments can use analysis to identify the root causes of employee turnover, identify patterns/demographics of historical employee data models, and design targeted actions based on this.
So, what methods/pathways are helpful to the HR department? Guess it? The answer is the SHAP method. So what exactly is it?
What is the SHAP method?
SHAP is a method and tool for explaining machine learning (ML) model output.
It can also explain what causes employees to voluntarily resign, which you will see in the article below.
But before that, you can install it through the pip terminal and the conda terminal.
<code>!pip install shap</code>
or
<code>conda install -c conda-forge shap</code>
IBM presented a dataset called "IBM HR Analytics Employee Attrition & Performance" in 2017, using SHAP tools/methods.
So, the following is a brief overview of the dataset, you can refer to the following content,
Dataset Overview
We will use the IBM HR Analytics Employee Attrition dataset. The dataset contains information about more than 1,400 employees—including age, salary, position roles, and satisfaction scores—to identify patterns using SHAP methods/tools.
We will then use the following key columns:
- Attrition : Whether the employee leaves
- Overtime, job satisfaction, monthly income, work and life balance

After that, you should actually apply the SHAP method/tool through the following 5 steps to overcome the risk of employee churn.
5 steps to SHAP tools/methods

Step 1: Load and explore the data
<code>import pandas as pd</code> from sklearn.model_selection import train_test_split<p> from sklearn.preprocessing import LabelEncoder</p><h1> Loading the dataset</h1><p> df = pd.read_csv('WA <em>Fn-UseC</em> -HR-Employee-Attrition.csv')</p><h1> Basic Exploration</h1><p> print("Shape of dataset:", df.shape)</p><p> print("Resignation value statistics:\n", df['Attrition'].value_counts())</p>
Step 2: Preprocess the data
Once the dataset is loaded, we convert the text value to numbers and divide the data into training and testing sections.
<code># 將目標變量轉換為二進制</code><p>df['Attrition'] = df['Attrition'].map({'Yes': 1, 'No': 0})</p><h1> Encode all classification characteristics</h1><p> label_enc = LabelEncoder()</p><p> category_cols = df.select_dtypes(include=['object']).columns</p><p> for col in category_cols:</p><p> df[col] = label_enc.fit_transform(df[col])</p><h1> Define features and goals</h1><p> X = df.drop('Attrition', axis=1)</p><p> y = df['Attrition']</p><h1> Divide the dataset into training and testing</h1><p> X_train, X_test, y_train, y_test = train_test_split(X, y, test_size=0.2, random_state=42)</p>
Step 3: Build the model
Now, we will use XGBoost, a fast and accurate machine learning model for evaluation.
<code>from xgboost import XGBClassifier</code><p> from sklearn.metrics import classification_report</p><h1> Initialize and train the model</h1><p> model = XGBClassifier(use_label_encoder=False, eval_metric='logloss')</p><p> model.fit(X_train, y_train)</p><h1> Predict and evaluate</h1><p> y_pred = model.predict(X_test)</p><p> print("Classification Report:\n", classification_report(y_test, y_pred))</p>
Step 4: Use SHAP to interpret the model
SHAP (SHapley Additive exPlanations) helps us understand which characteristics/factors are most important in predicting churn rates.
<code>import shap</code><h1> Initialize SHAP</h1><p> shap.initjs()</p><h1> Explain model predictions</h1><p> explainer = shap.Explainer(model)</p><p> shap_values = explainer(X_test)</p><h1> Summary</h1><p> shap.summary_plot(shap_values, X_test)</p>
Step 5: Visualize Key Relationships
We will use SHAP dependency graphs or seaborn to visualize resignation and overtime.
<code>import seaborn as sns</code><p> import matplotlib.pyplot as plt</p><h1> Visualize resignation and overtime</h1><p> plt.figure(figsize=(8, 5))</p><p> sns.countplot(x='OverTime', hue='Attrition', data=df)</p><p> plt.title("Resignation and overtime")</p><p> plt.xlabel("Overtime Situation")</p><p> plt.ylabel("Count")</p><p> plt.show()</p>
Output:

Now, let's shift our focus to 5 business insights from our data
| feature | Insight |
|---|---|
| Overtime situation | High overtime rate increases churn rate |
| Job satisfaction | Higher satisfaction reduces churn rate |
| Monthly income | Lower revenue may increase churn |
| Years in the company | New employees are more likely to leave |
| Work-life balance | Poor equilibrium = higher churn rate |
However, of the 5 insights, 3 key insights from IBM datasets based on SHAP approaches are something that companies and HR departments should actively pay attention to.
3 key insights from IBM datasets based on SHAP method:
- Employees who work overtime are more likely to leave.
- Low job and environmental satisfaction increases the risk of churn.
- Monthly income also has an impact, but it is not as significant as overtime and job satisfaction.
Therefore, the HR department can use the above insights to find better solutions.
Revise the plan
Now that we know what factors are important, the HR department can follow these 4 solutions to guide HR policies.
- Revisiting compensation plans
Employees have families to support, bills to pay, and lifestyle to maintain. If companies don’t revisit their compensation plans, they are likely to lose their employees and face competitive disadvantages in their business.
- Reduce overtime or provide incentives
Sometimes, work can be waited, but stress cannot. Why? Because overtime does not mean motivation. A nervous shoulder without motivation can lead to various insecurity and health problems.
- Improve job satisfaction through employee feedback
Feedback is not just a tool to move forward, it is also an implementation cycle/guideline for what should be an invisible future. If employee turnover is a problem, then employees are the solution. Asking helps, assuming it will erode.
- Promote a better balance between work and life
People join work not only because of social pressure, but also to discover their true selves and their abilities. Finding a job that meets both goals can help improve their productivity; however, over-utilizing skills can be counterproductive and illogical for companies.
Therefore, SHAP-based method datasets are very suitable:
- Churn Prediction
- Labor Optimization
- Interpretable AI Tutorial (SHAP/LIME)
- Feature importance visualization
- Human Resources Analysis Dashboard
in conclusion
Predicting employee turnover can help companies retain the best employees and thus maximize profits. Therefore, through machine learning and SHAP, the company
The above is the detailed content of Predict Employee Attrition with SHAP: An HR Analytics Guide. For more information, please follow other related articles on the PHP Chinese website!

Hot AI Tools

Undress AI Tool
Undress images for free

Undresser.AI Undress
AI-powered app for creating realistic nude photos

AI Clothes Remover
Online AI tool for removing clothes from photos.

Clothoff.io
AI clothes remover

Video Face Swap
Swap faces in any video effortlessly with our completely free AI face swap tool!

Hot Article
Hot Tools

Notepad++7.3.1
Easy-to-use and free code editor

SublimeText3 Chinese version
Chinese version, very easy to use

Zend Studio 13.0.1
Powerful PHP integrated development environment

Dreamweaver CS6
Visual web development tools

SublimeText3 Mac version
God-level code editing software (SublimeText3)
Hot Topics


 AI Investor Stuck At A Standstill? 3 Strategic Paths To Buy, Build, Or Partner With AI Vendors
Jul 02, 2025 am 11:13 AM
AI Investor Stuck At A Standstill? 3 Strategic Paths To Buy, Build, Or Partner With AI Vendors
Jul 02, 2025 am 11:13 AM
Investing is booming, but capital alone isn’t enough. With valuations rising and distinctiveness fading, investors in AI-focused venture funds must make a key decision: Buy, build, or partner to gain an edge? Here’s how to evaluate each option—and pr
 AGI And AI Superintelligence Are Going To Sharply Hit The Human Ceiling Assumption Barrier
Jul 04, 2025 am 11:10 AM
AGI And AI Superintelligence Are Going To Sharply Hit The Human Ceiling Assumption Barrier
Jul 04, 2025 am 11:10 AM
Let’s talk about it. This analysis of an innovative AI breakthrough is part of my ongoing Forbes column coverage on the latest in AI, including identifying and explaining various impactful AI complexities (see the link here). Heading Toward AGI And
 Kimi K2: The Most Powerful Open-Source Agentic Model
Jul 12, 2025 am 09:16 AM
Kimi K2: The Most Powerful Open-Source Agentic Model
Jul 12, 2025 am 09:16 AM
Remember the flood of open-source Chinese models that disrupted the GenAI industry earlier this year? While DeepSeek took most of the headlines, Kimi K1.5 was one of the prominent names in the list. And the model was quite cool.
 Future Forecasting A Massive Intelligence Explosion On The Path From AI To AGI
Jul 02, 2025 am 11:19 AM
Future Forecasting A Massive Intelligence Explosion On The Path From AI To AGI
Jul 02, 2025 am 11:19 AM
Let’s talk about it. This analysis of an innovative AI breakthrough is part of my ongoing Forbes column coverage on the latest in AI, including identifying and explaining various impactful AI complexities (see the link here). For those readers who h
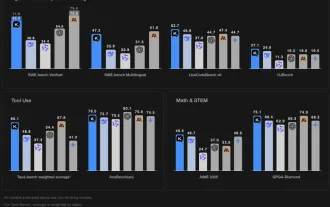
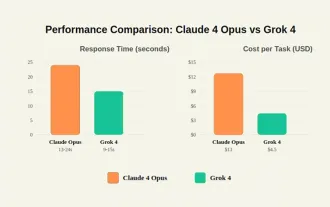 Grok 4 vs Claude 4: Which is Better?
Jul 12, 2025 am 09:37 AM
Grok 4 vs Claude 4: Which is Better?
Jul 12, 2025 am 09:37 AM
By mid-2025, the AI “arms race” is heating up, and xAI and Anthropic have both released their flagship models, Grok 4 and Claude 4. These two models are at opposite ends of the design philosophy and deployment platform, yet they
 Chain Of Thought For Reasoning Models Might Not Work Out Long-Term
Jul 02, 2025 am 11:18 AM
Chain Of Thought For Reasoning Models Might Not Work Out Long-Term
Jul 02, 2025 am 11:18 AM
For example, if you ask a model a question like: “what does (X) person do at (X) company?” you may see a reasoning chain that looks something like this, assuming the system knows how to retrieve the necessary information:Locating details about the co
 This Startup Built A Hospital In India To Test Its AI Software
Jul 02, 2025 am 11:14 AM
This Startup Built A Hospital In India To Test Its AI Software
Jul 02, 2025 am 11:14 AM
Clinical trials are an enormous bottleneck in drug development, and Kim and Reddy thought the AI-enabled software they’d been building at Pi Health could help do them faster and cheaper by expanding the pool of potentially eligible patients. But the
 Senate Kills 10-Year State-Level AI Ban Tucked In Trump's Budget Bill
Jul 02, 2025 am 11:16 AM
Senate Kills 10-Year State-Level AI Ban Tucked In Trump's Budget Bill
Jul 02, 2025 am 11:16 AM
The Senate voted 99-1 Tuesday morning to kill the moratorium after a last-minute uproar from advocacy groups, lawmakers and tens of thousands of Americans who saw it as a dangerous overreach. They didn’t stay quiet. The Senate listened.States Keep Th
